47,031
Page views (May, 2021 –July, 2023)
”“I really like it for the niche it fills. A lot of online tools are very counterintuitive. This one didn't feel punishing to use.”
—A high school student from a field test
My roles
- Product owner
- Content lead
- Product design
- Interaction design
- Visual design
- UX research
- Illustrator
- Animator
Intended audience
Educators and students in advanced high school and undergraduate biology classes
Background
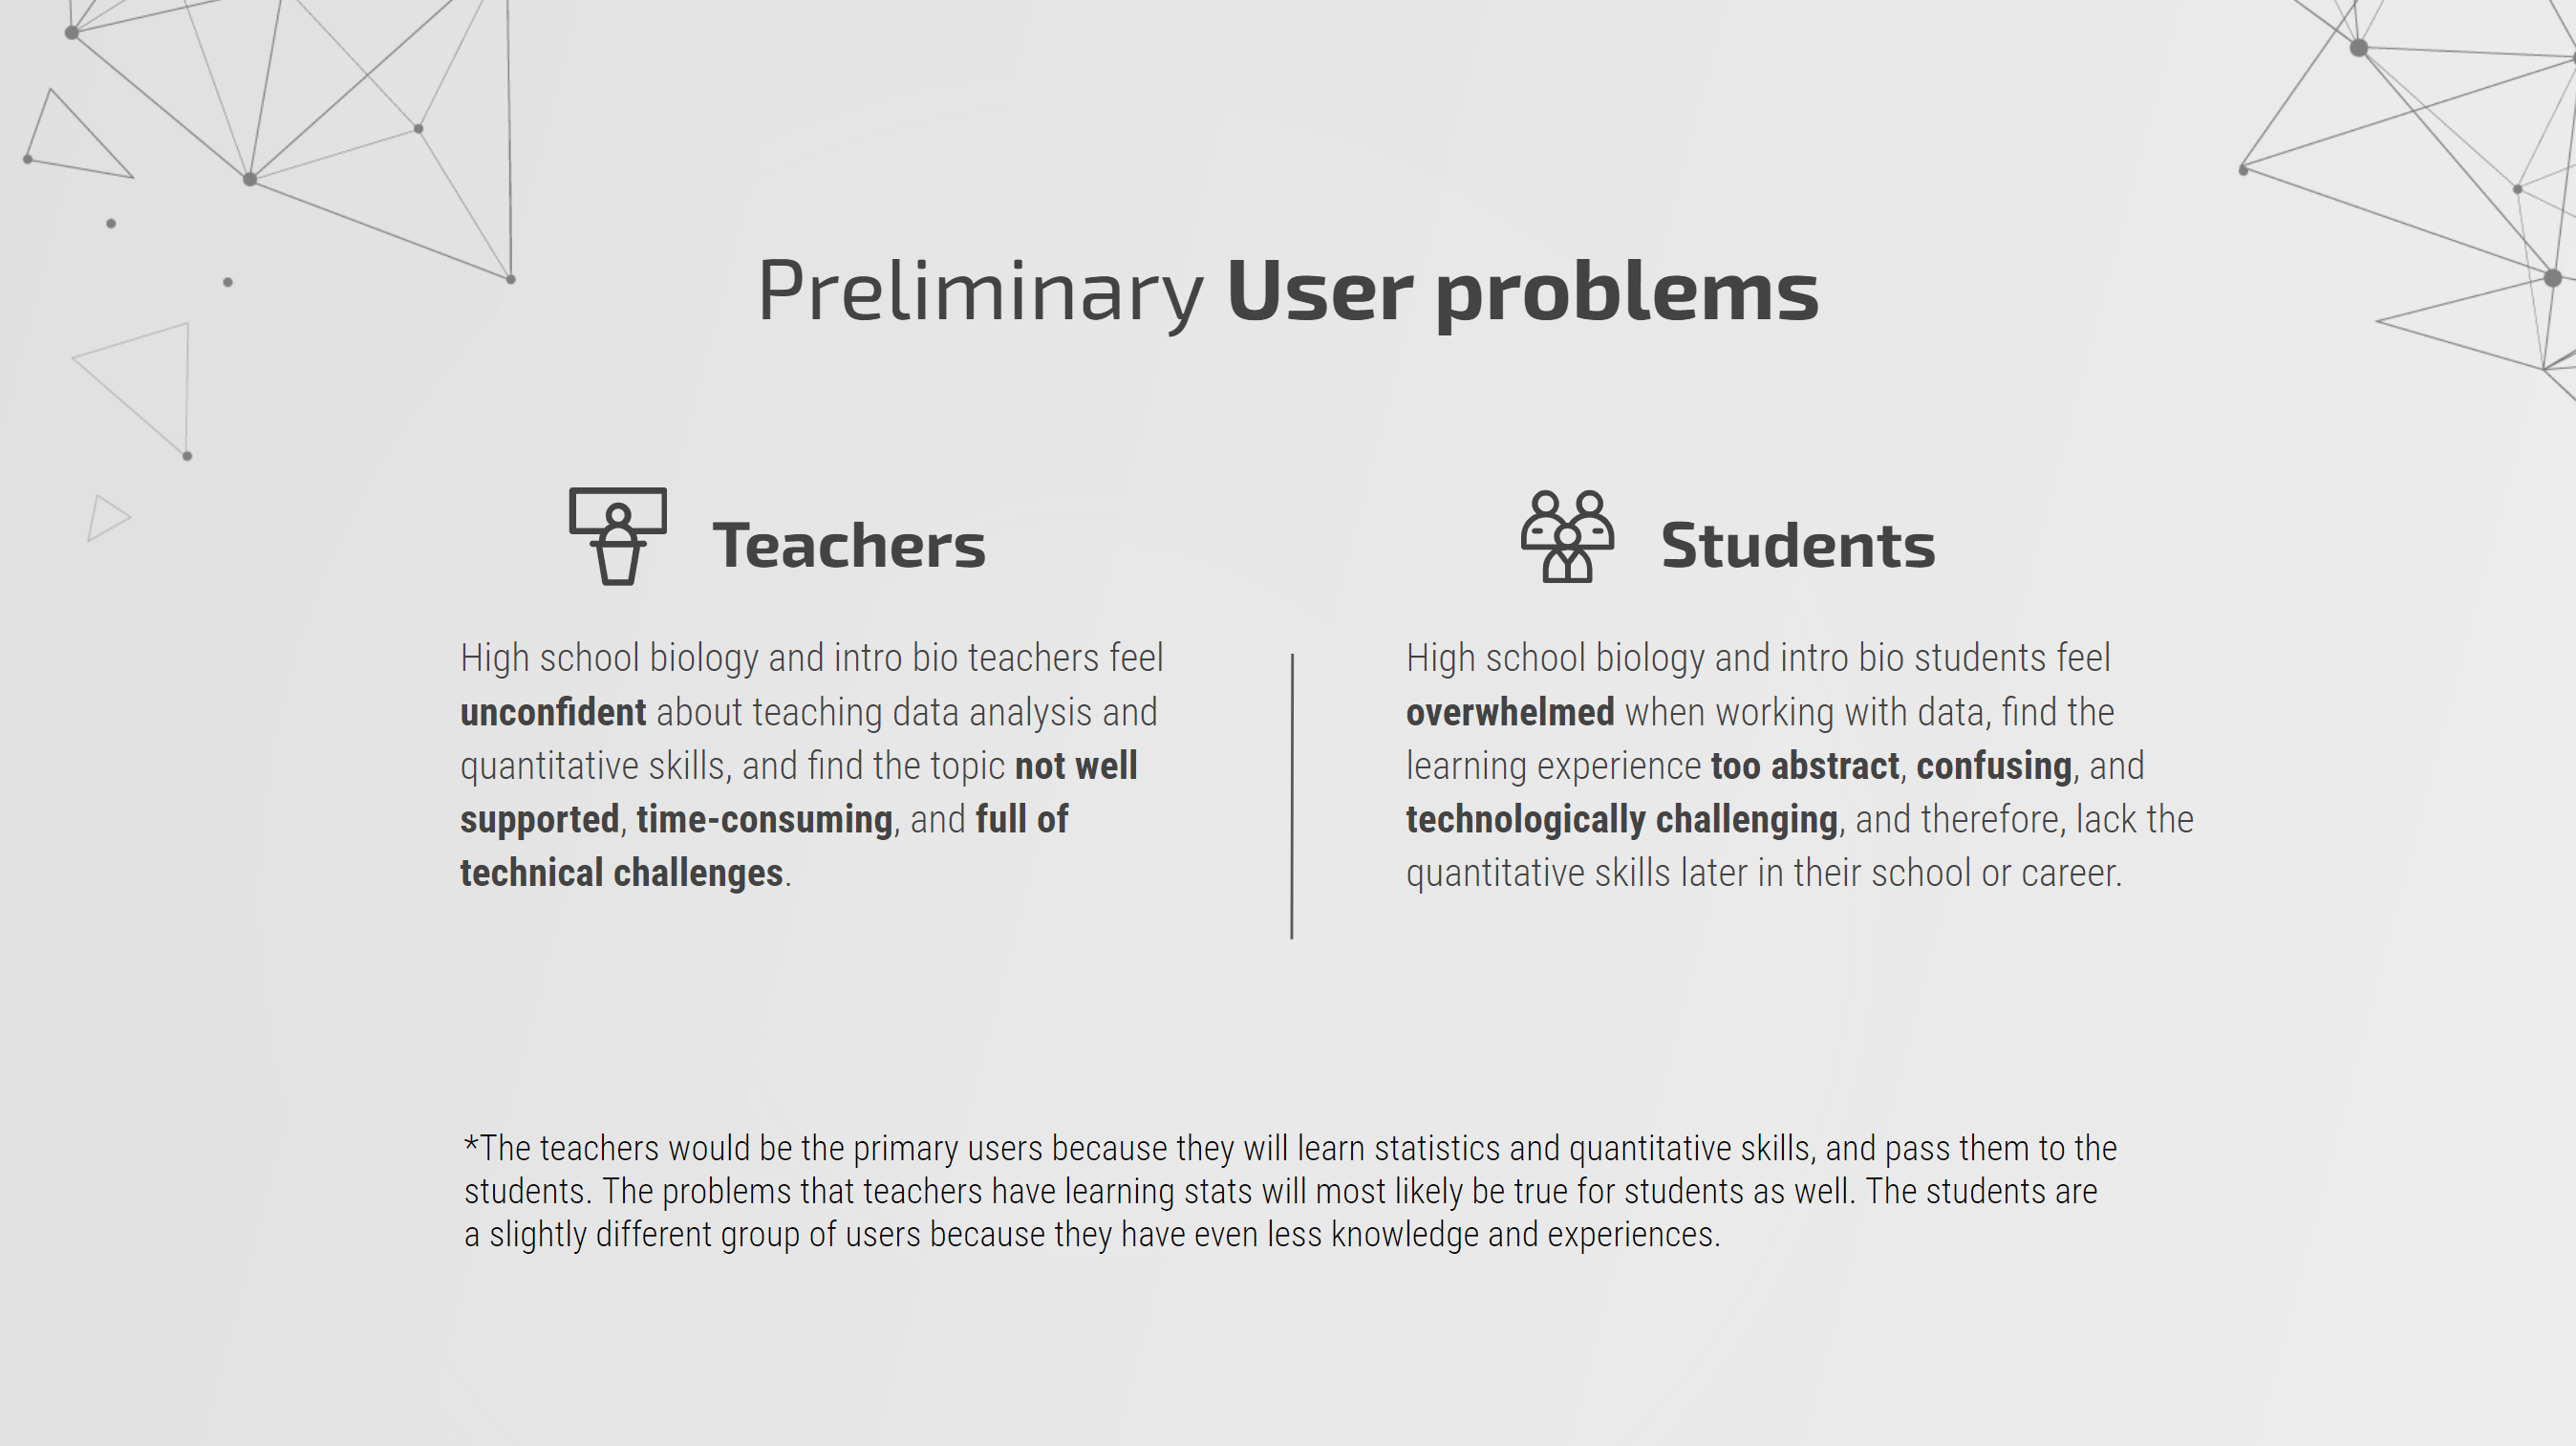
We heard frequently from biology/environmental science/chemistry educators about not feeling confident in teaching data analysis and quantitative skills recommended (or required in some schools) in the curriculum standards in high school biology and undergraduate introductory biology courses.
Empathize & Define
Initial user and stakeholder interviews
”"There's such a gap between students who can evaluate figures and those who can't."
—Undergraduate biology teacher
”"We do not have many opportunities to practice quantitative skills."
—Undergraduate biology teacher
”"I don’t want students just pushing buttons and getting magic answers."
—High school biology teacher
”"I want something where I can load in the data set easily...something with a super simple interface so they don’t get bogged down in the tech details. I do think when stat tests are too easily accessible in a software package, it encourages the students to just throw it in and not think critically about the test they are setting up and why they are running it."
—Undergraduate biology teacher
”"I used to run stats workshops at NABT and NSTA. The lack of fundamental understanding of statistics by high school teachers is widespread."
—Colleague, content developer
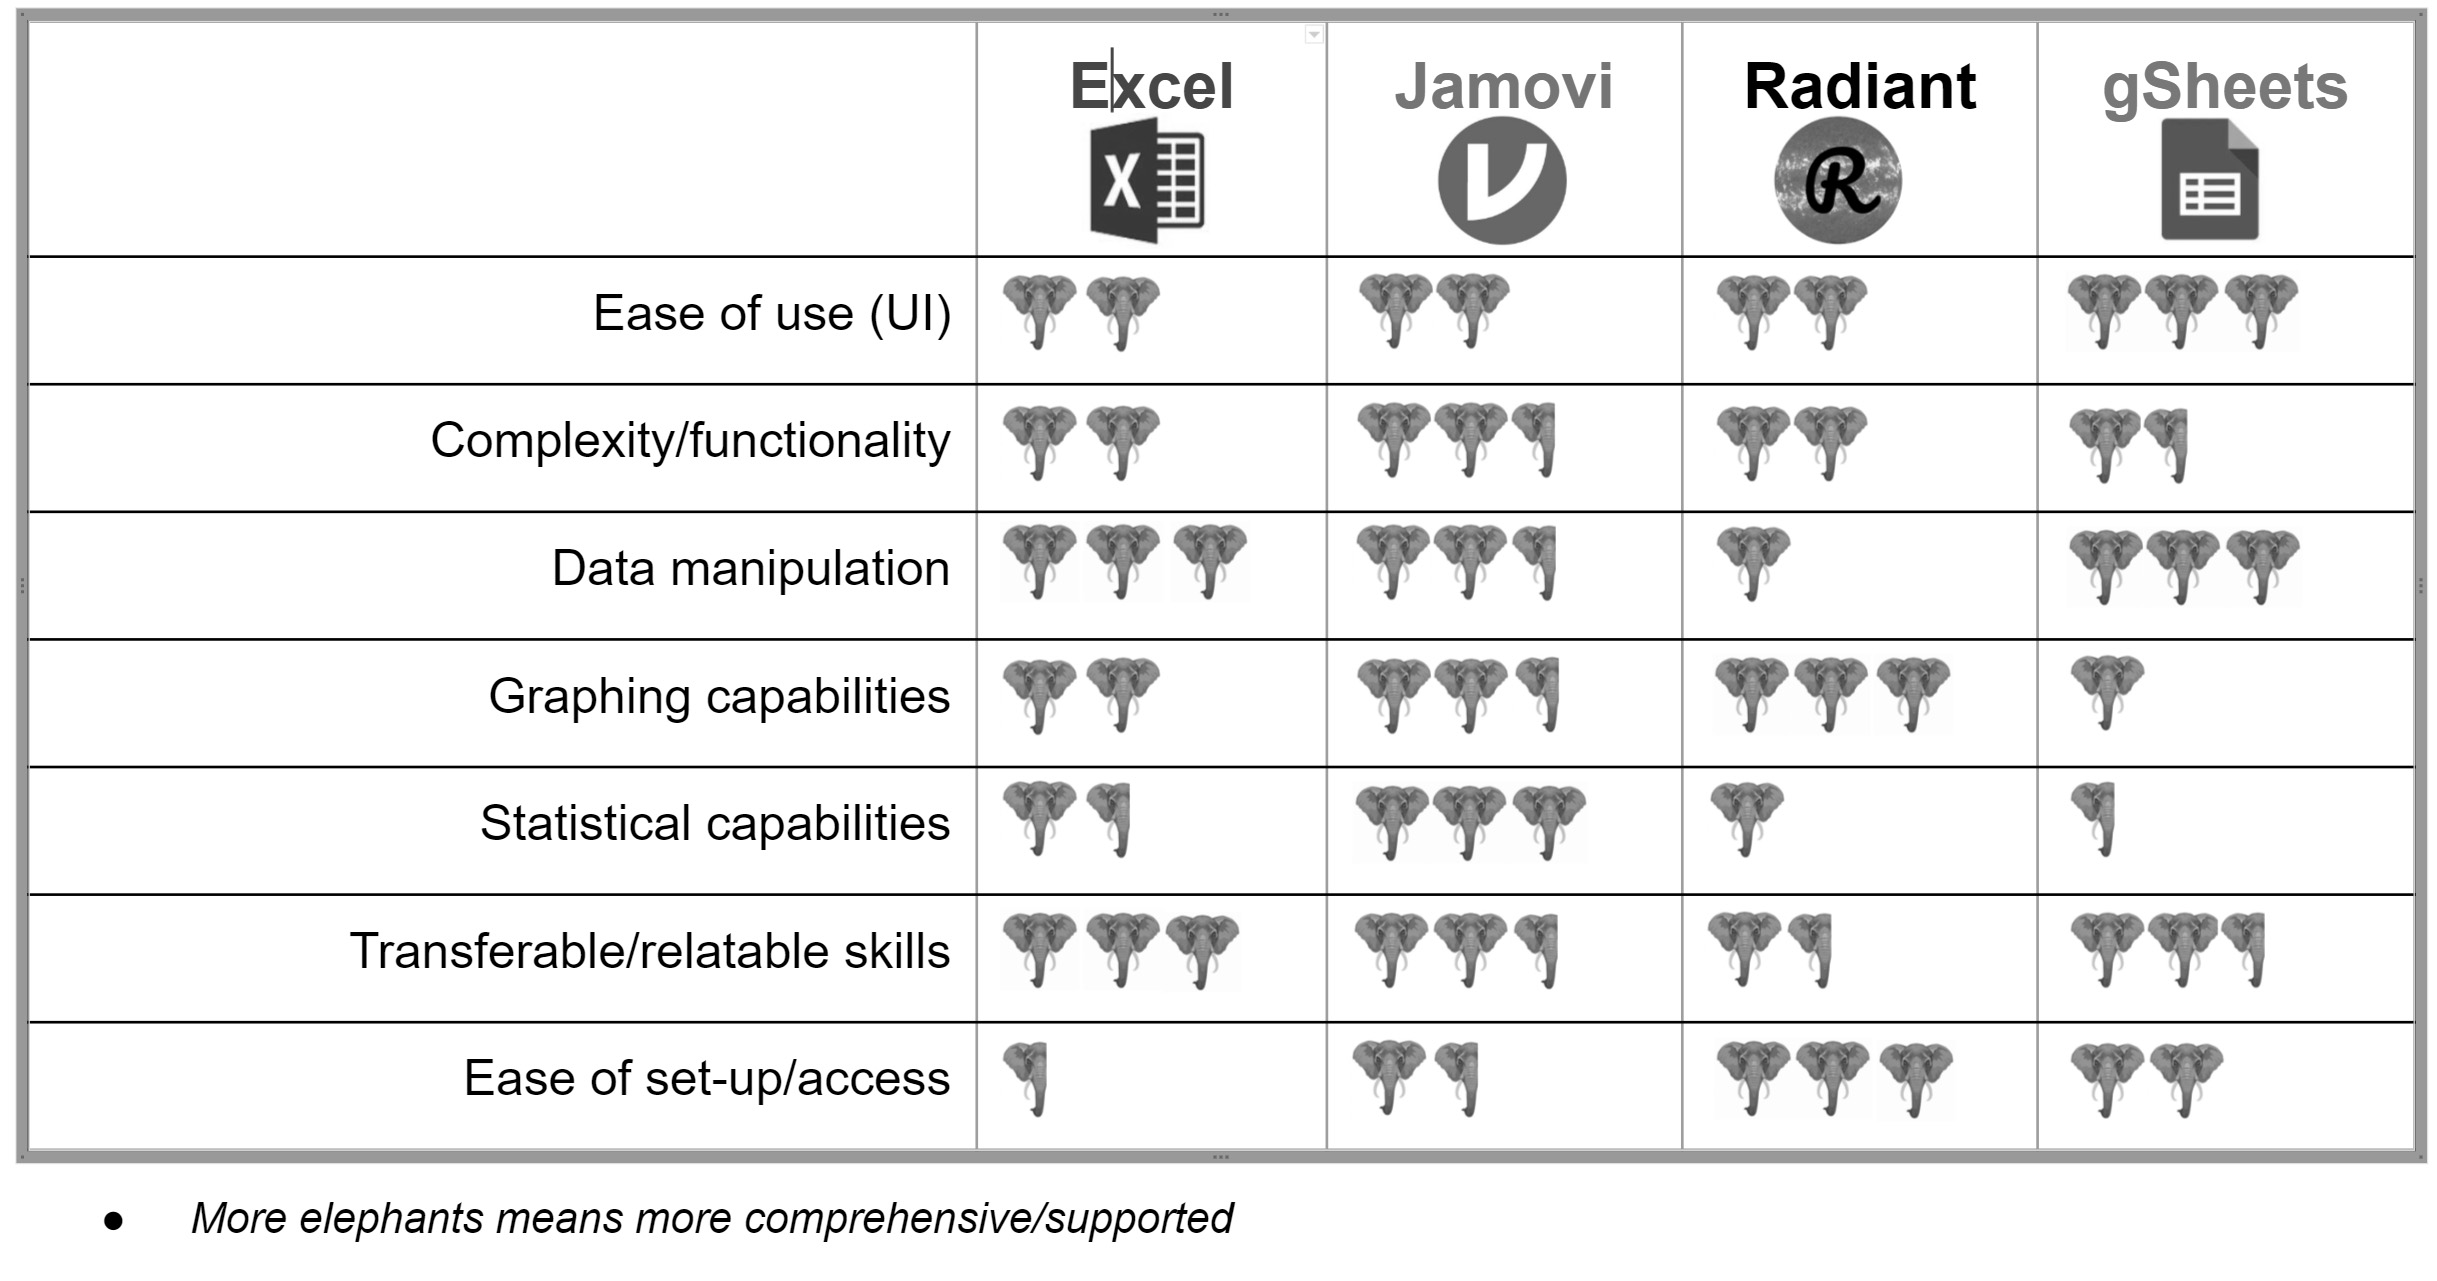
Competitive analysis of existing apps
User problems
Goals
We would like to provide some creative solutions to improve their comfort level for teaching and learning data analysis and quantitative skills in biology courses. Some expected outcomes:
- Establish a baseline understanding of the obstacles
- Lower the barrier of teaching quantitative skills in biology courses
- Enhance the students’ interests and performance in data analysis
Ideate
A series of resources were proposed to support this effort. One of them is a web app that allows allows students to do data visualization and analysis quickly. The initial concept was proposed by Drew Lamar, PhD, and David Julian, PhD, as shown below. I then led the design and production of this app.
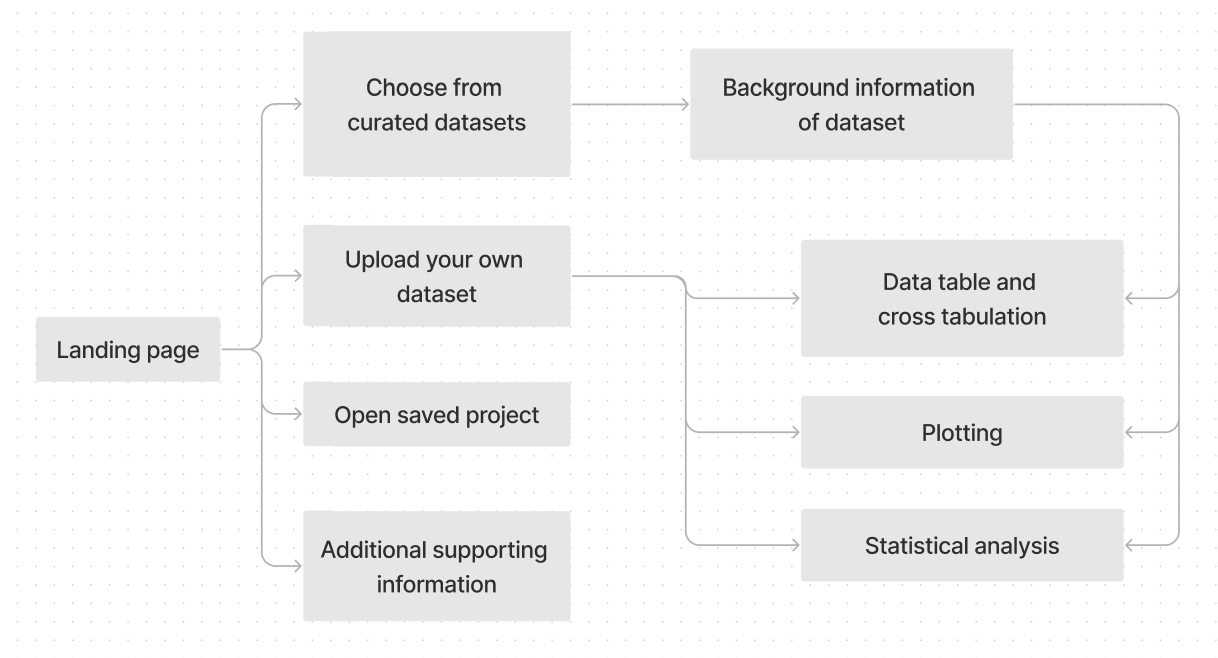
High level user flow


More UX research
While we were fleshing things out, we realized that we still had many questions about the exact problem we were solving. I proposed to take a step back and do more UX research with educators.
- Collaborated with our evaluation director, Marjee Chmiel, PhD, three focus groups were conducted in order to surface how teachers talk about teaching statistics to high school life science students.
- We wanted to better understand teachers’ needs, possibilities, challenges, obstacles, and opportunities when it comes to integrating quantitative skills in high school biology and environmental science.
- The minimum viable product was shared before the focus group to set the context.
Findings: Teachers jobs-to-be-done
- Teachers want to increase data literacy among students
- Teachers need to meet third-party standards
- When it comes to learning statistics, most teachers were auto-didacts
- Developing a conceptual understanding is of primary importance
- Relative consistency in statistical skills currently taught
Findings: Gains
- Using statistics to arrive at conclusions provides opportunities for students to have greater ownership over what they learn in biology.
- The most interesting data for students is the data they generated themselves.
Findings: Pains
- Lack of compelling student resources
- Lack of data sets
- Keep it “low tech”
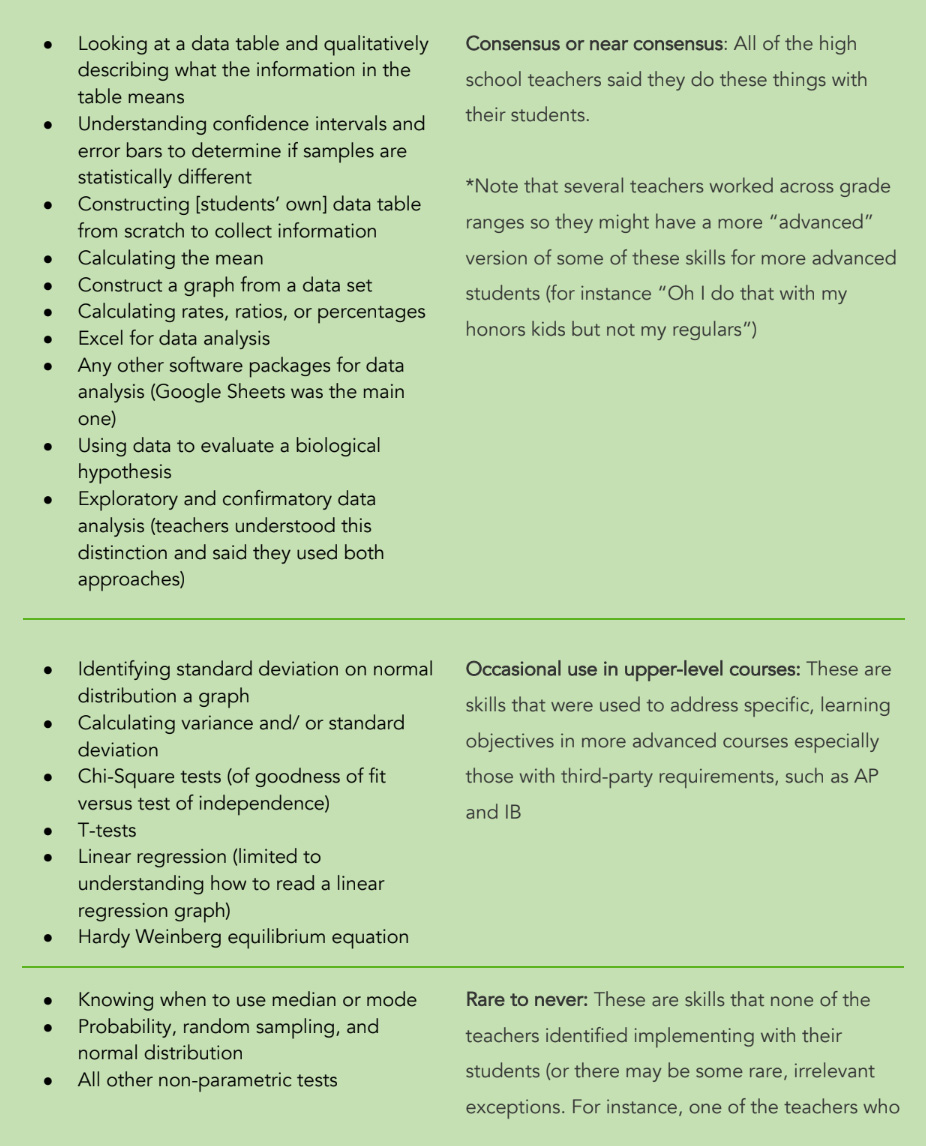
Priority of tasks/skills taught
Final build
A few more iterations were done based on the UX research findings, stakeholder reviews, and WCAG accessibility audit findings. The stories/requests were implemented by the third party programmer.
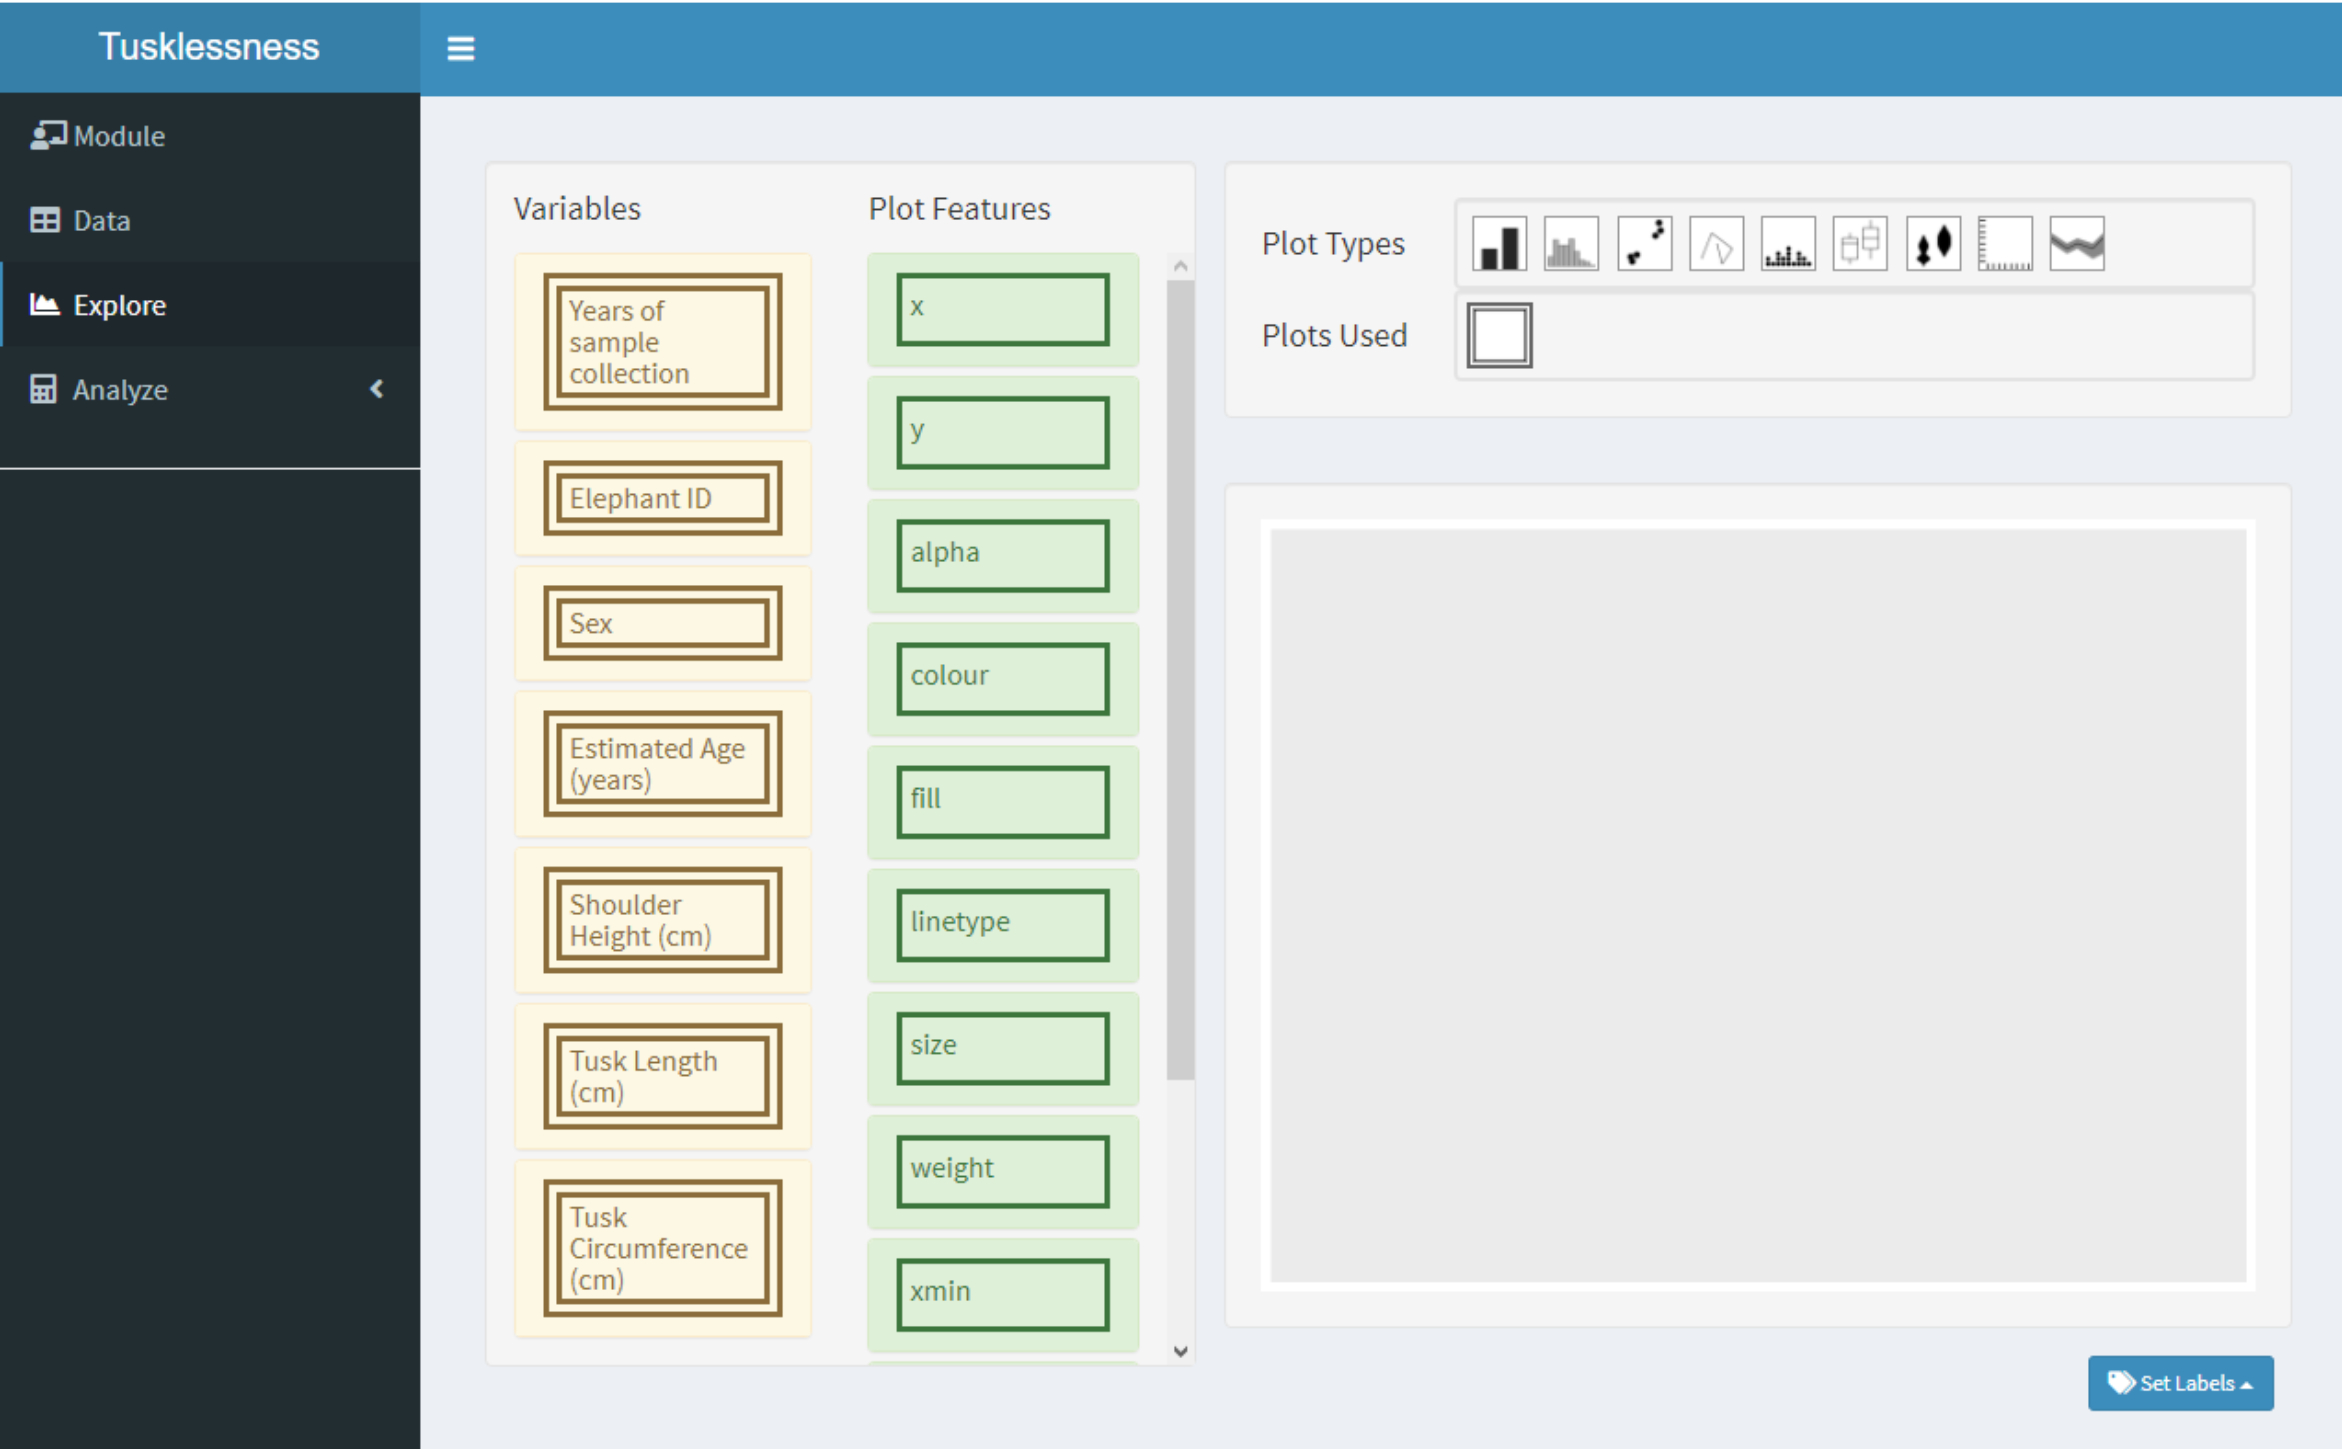
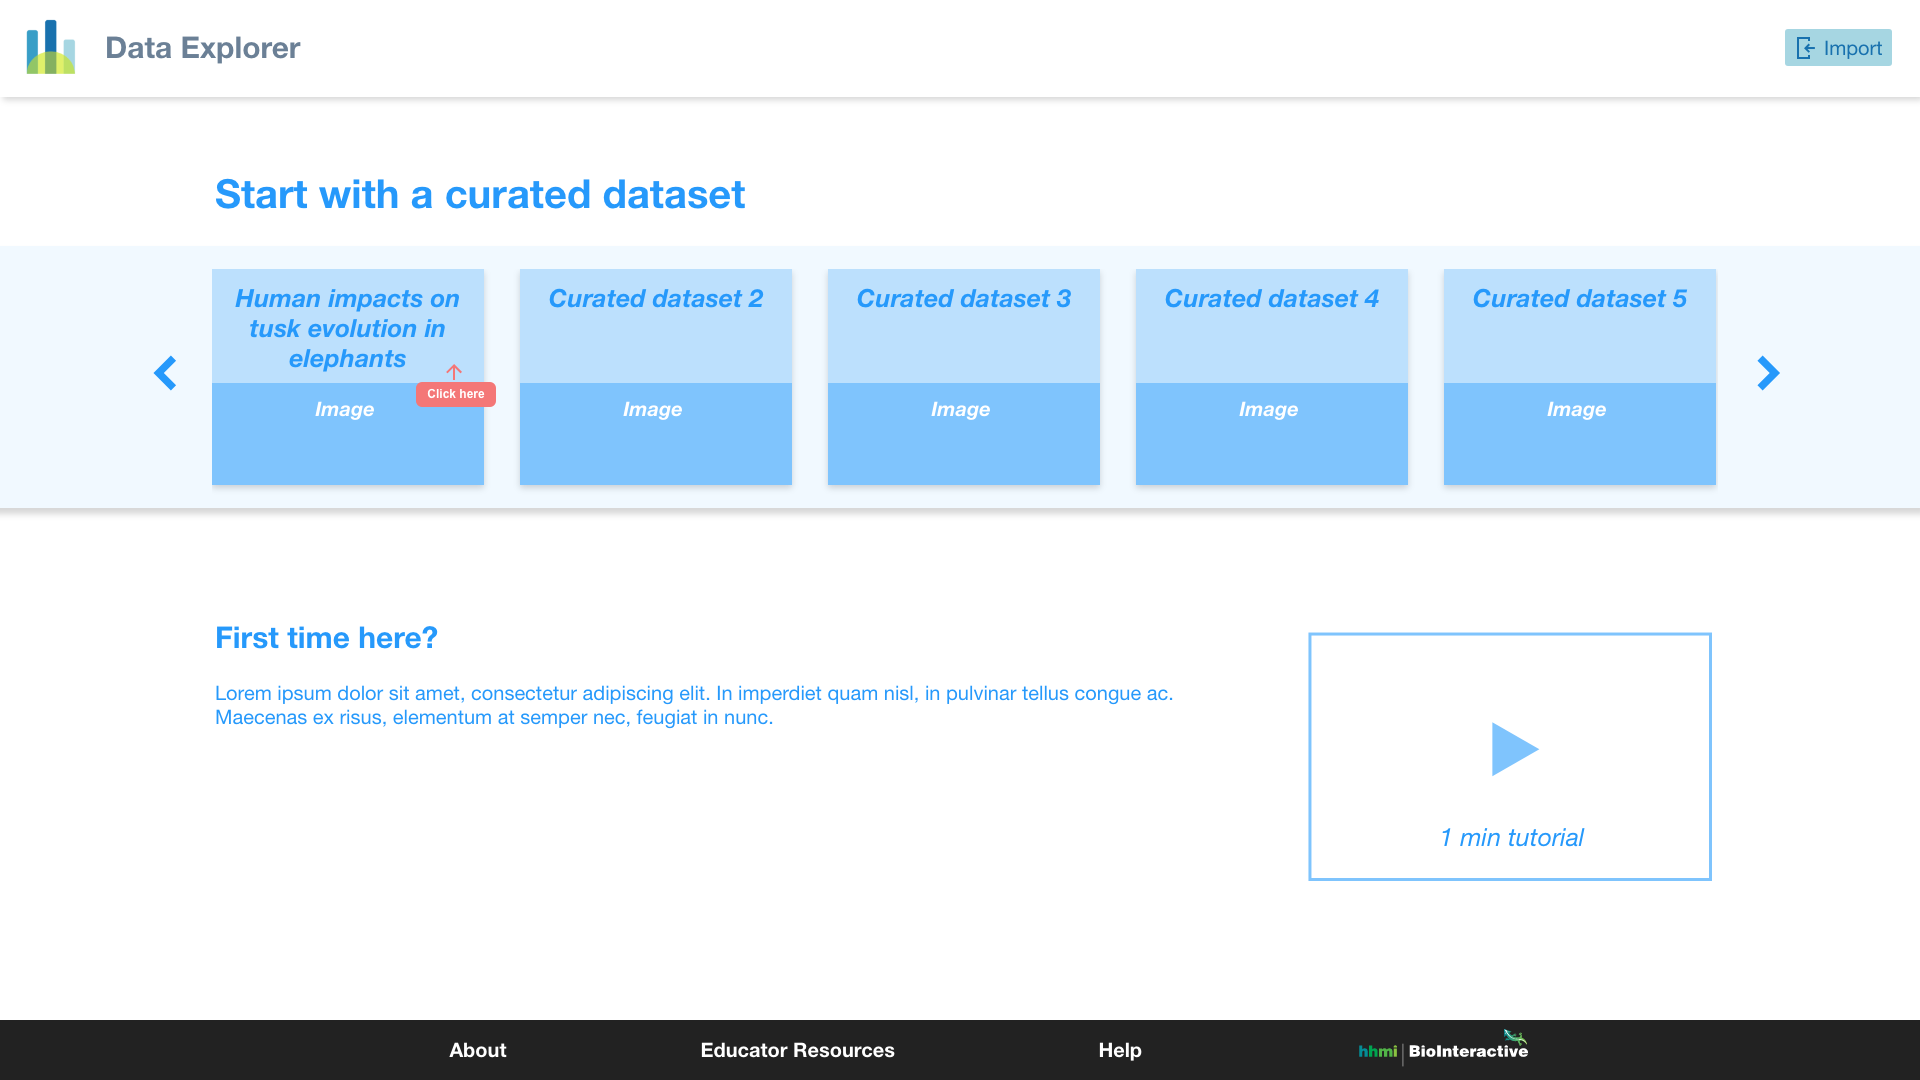
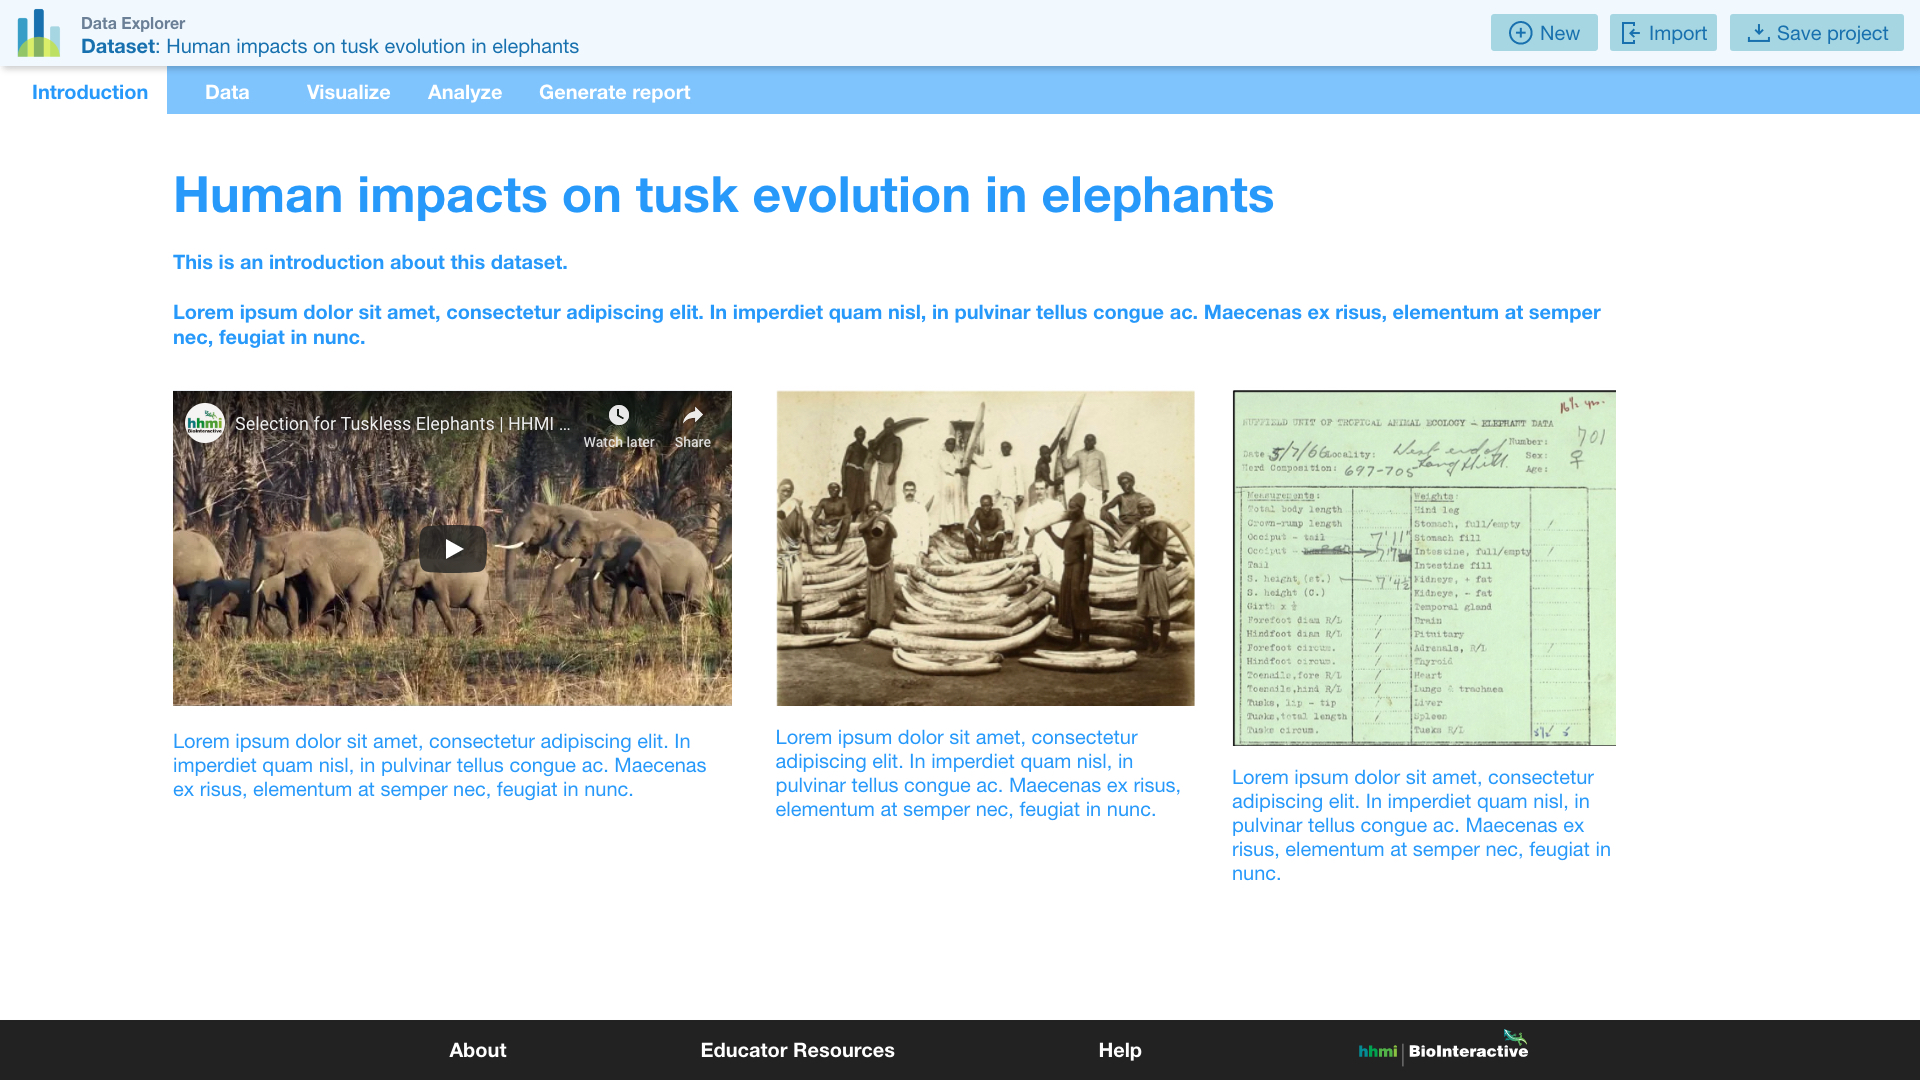
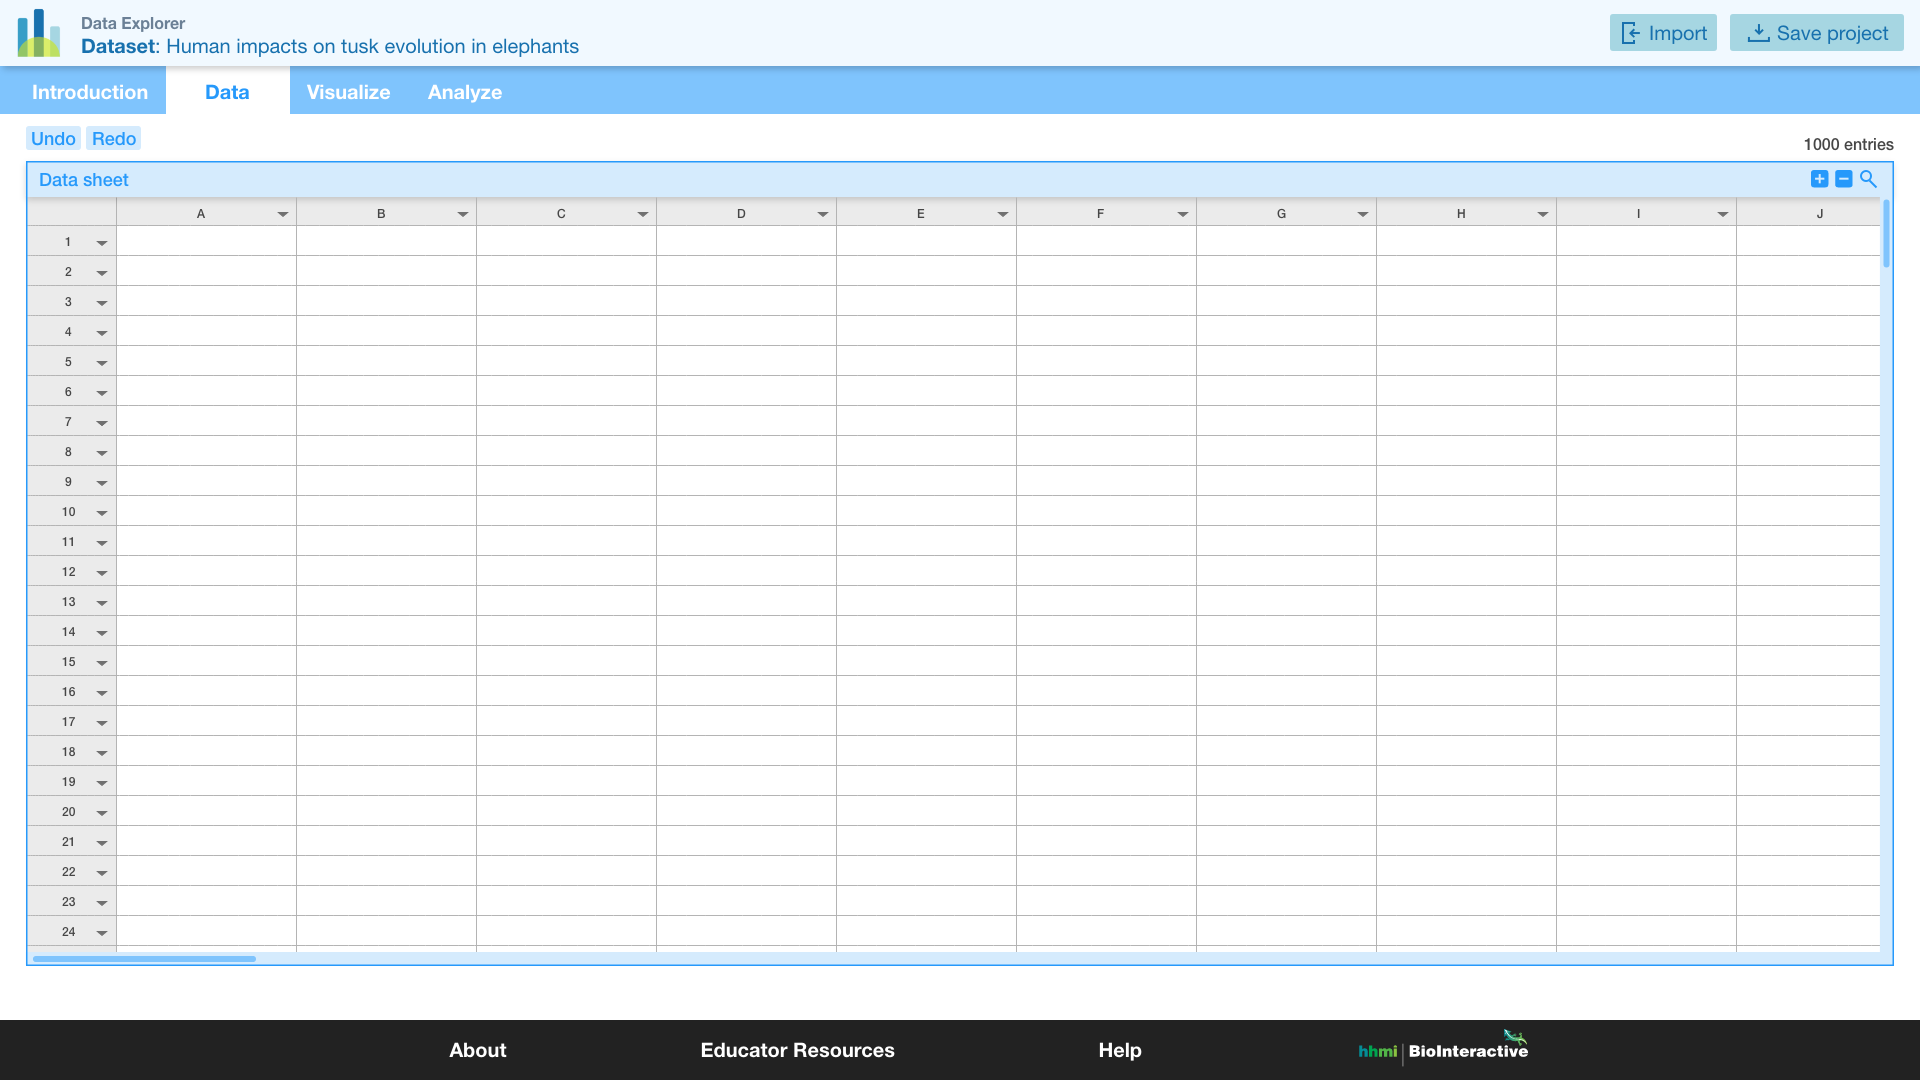
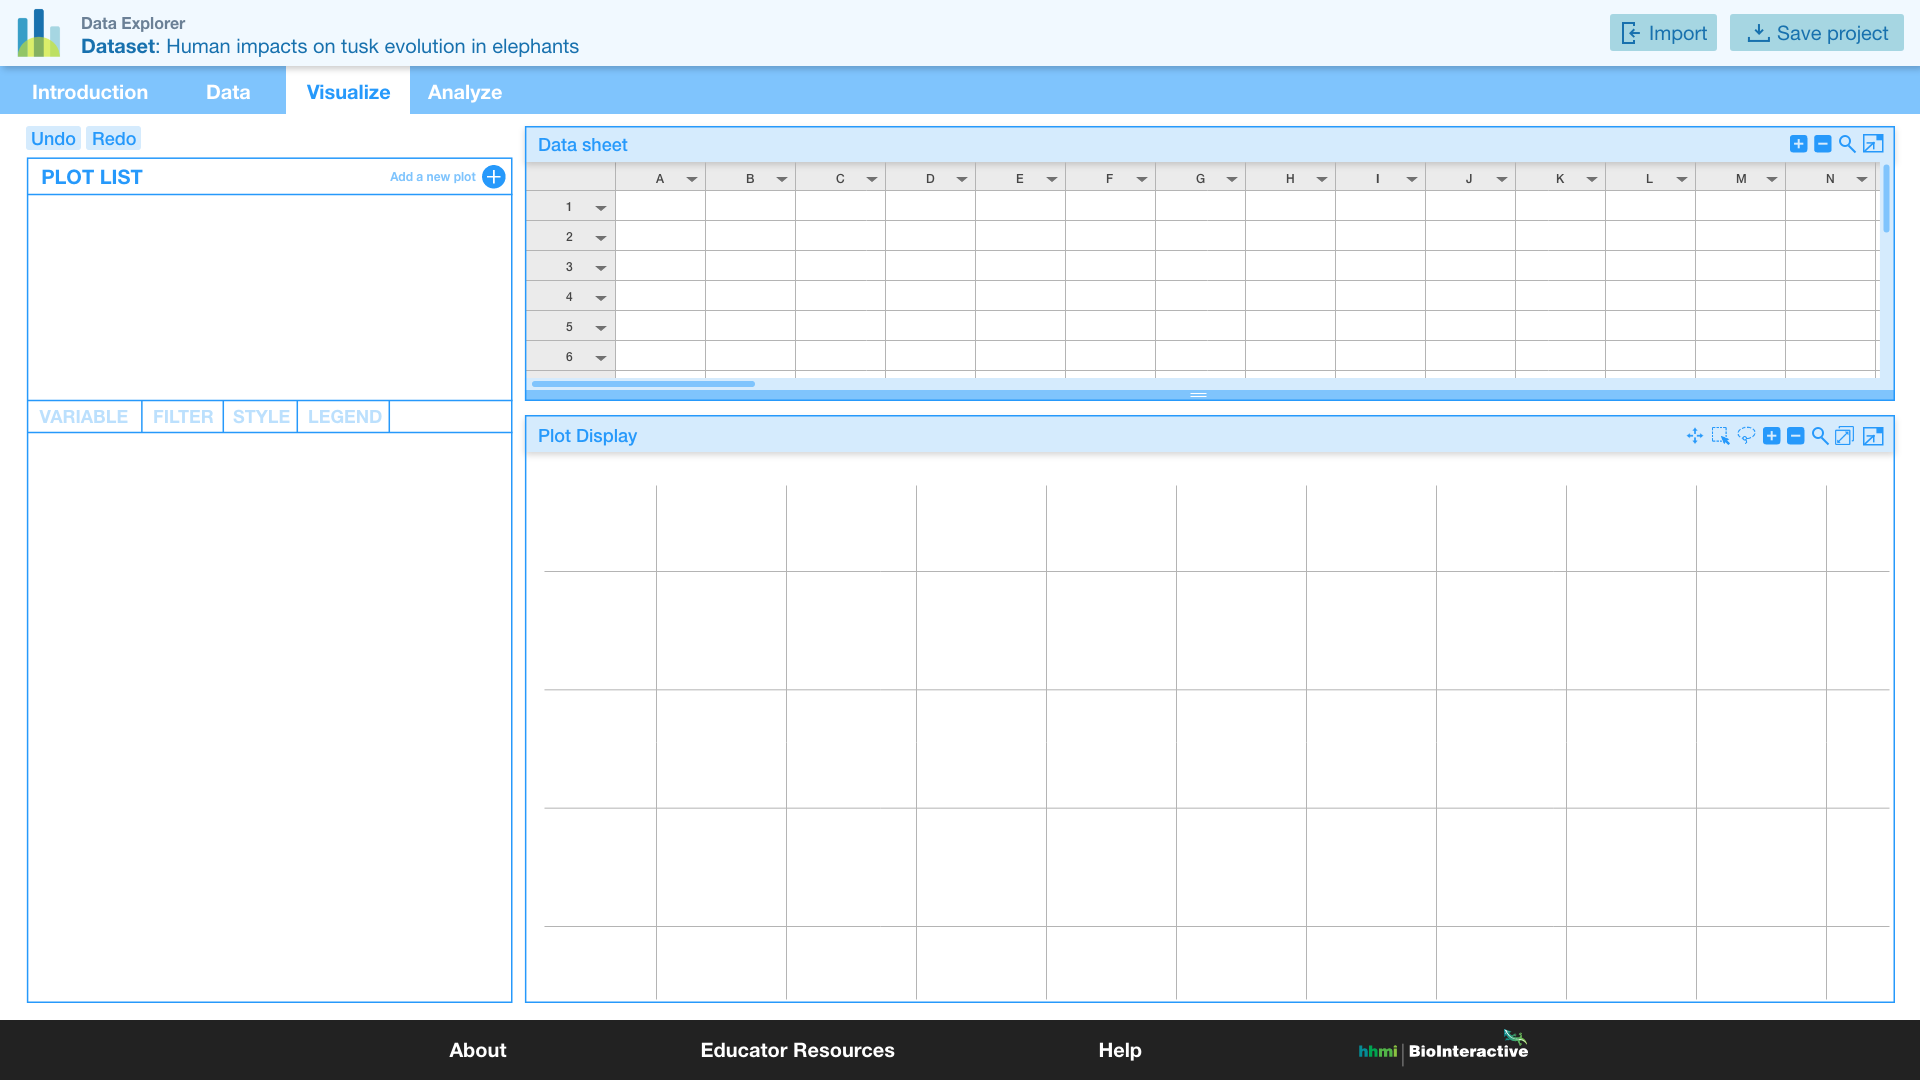
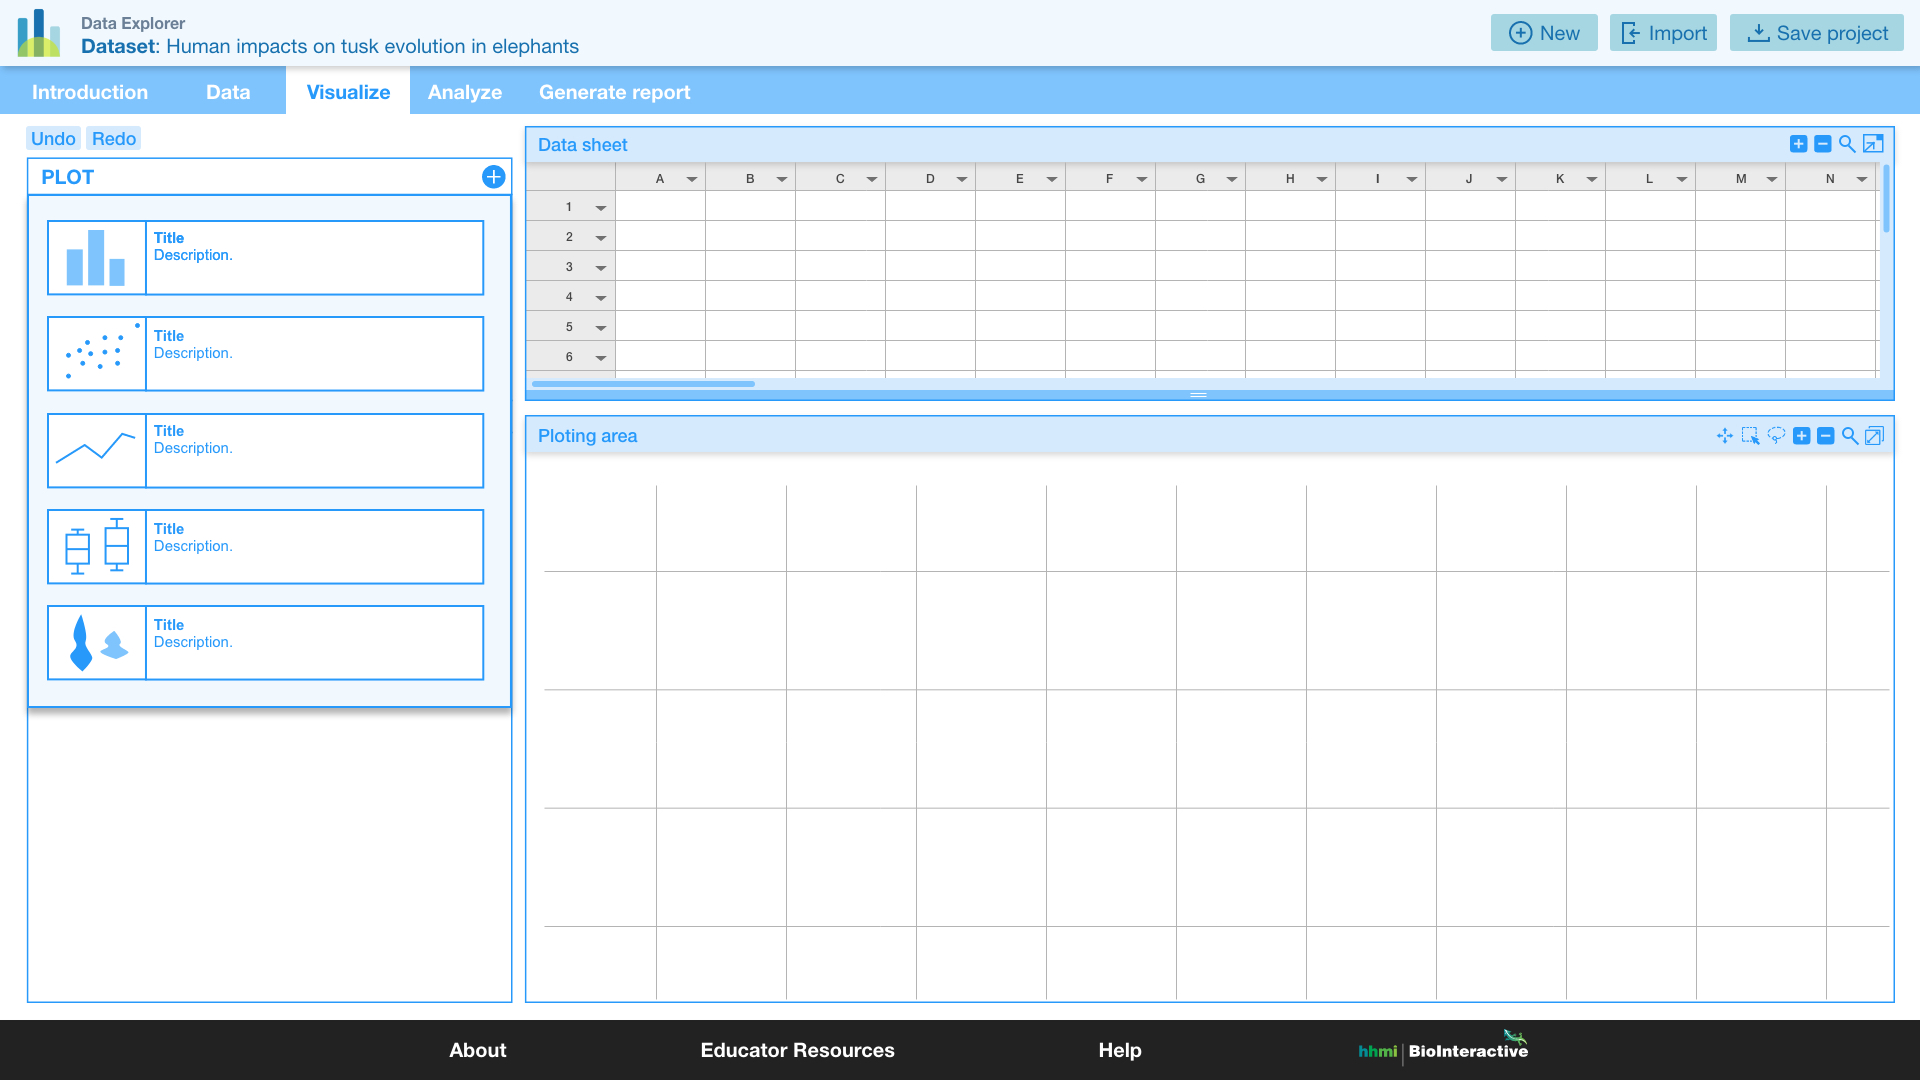
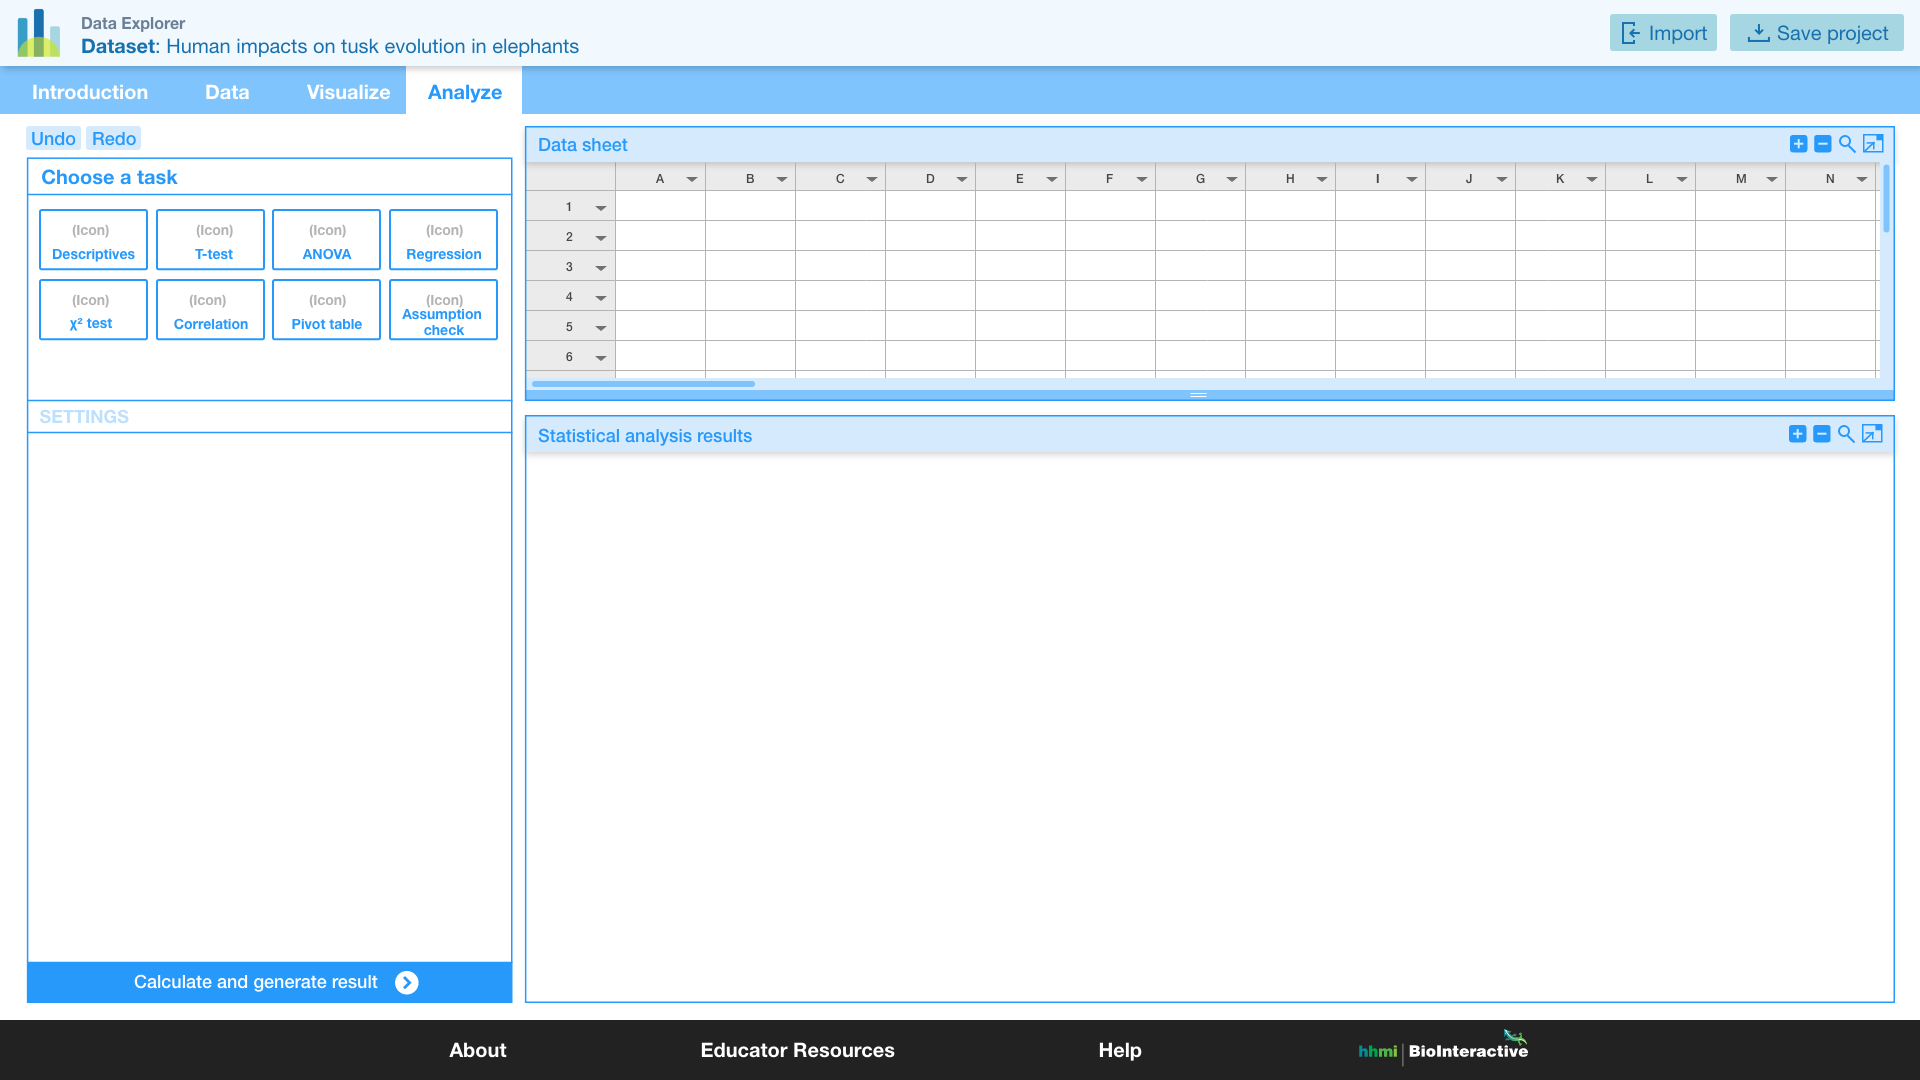
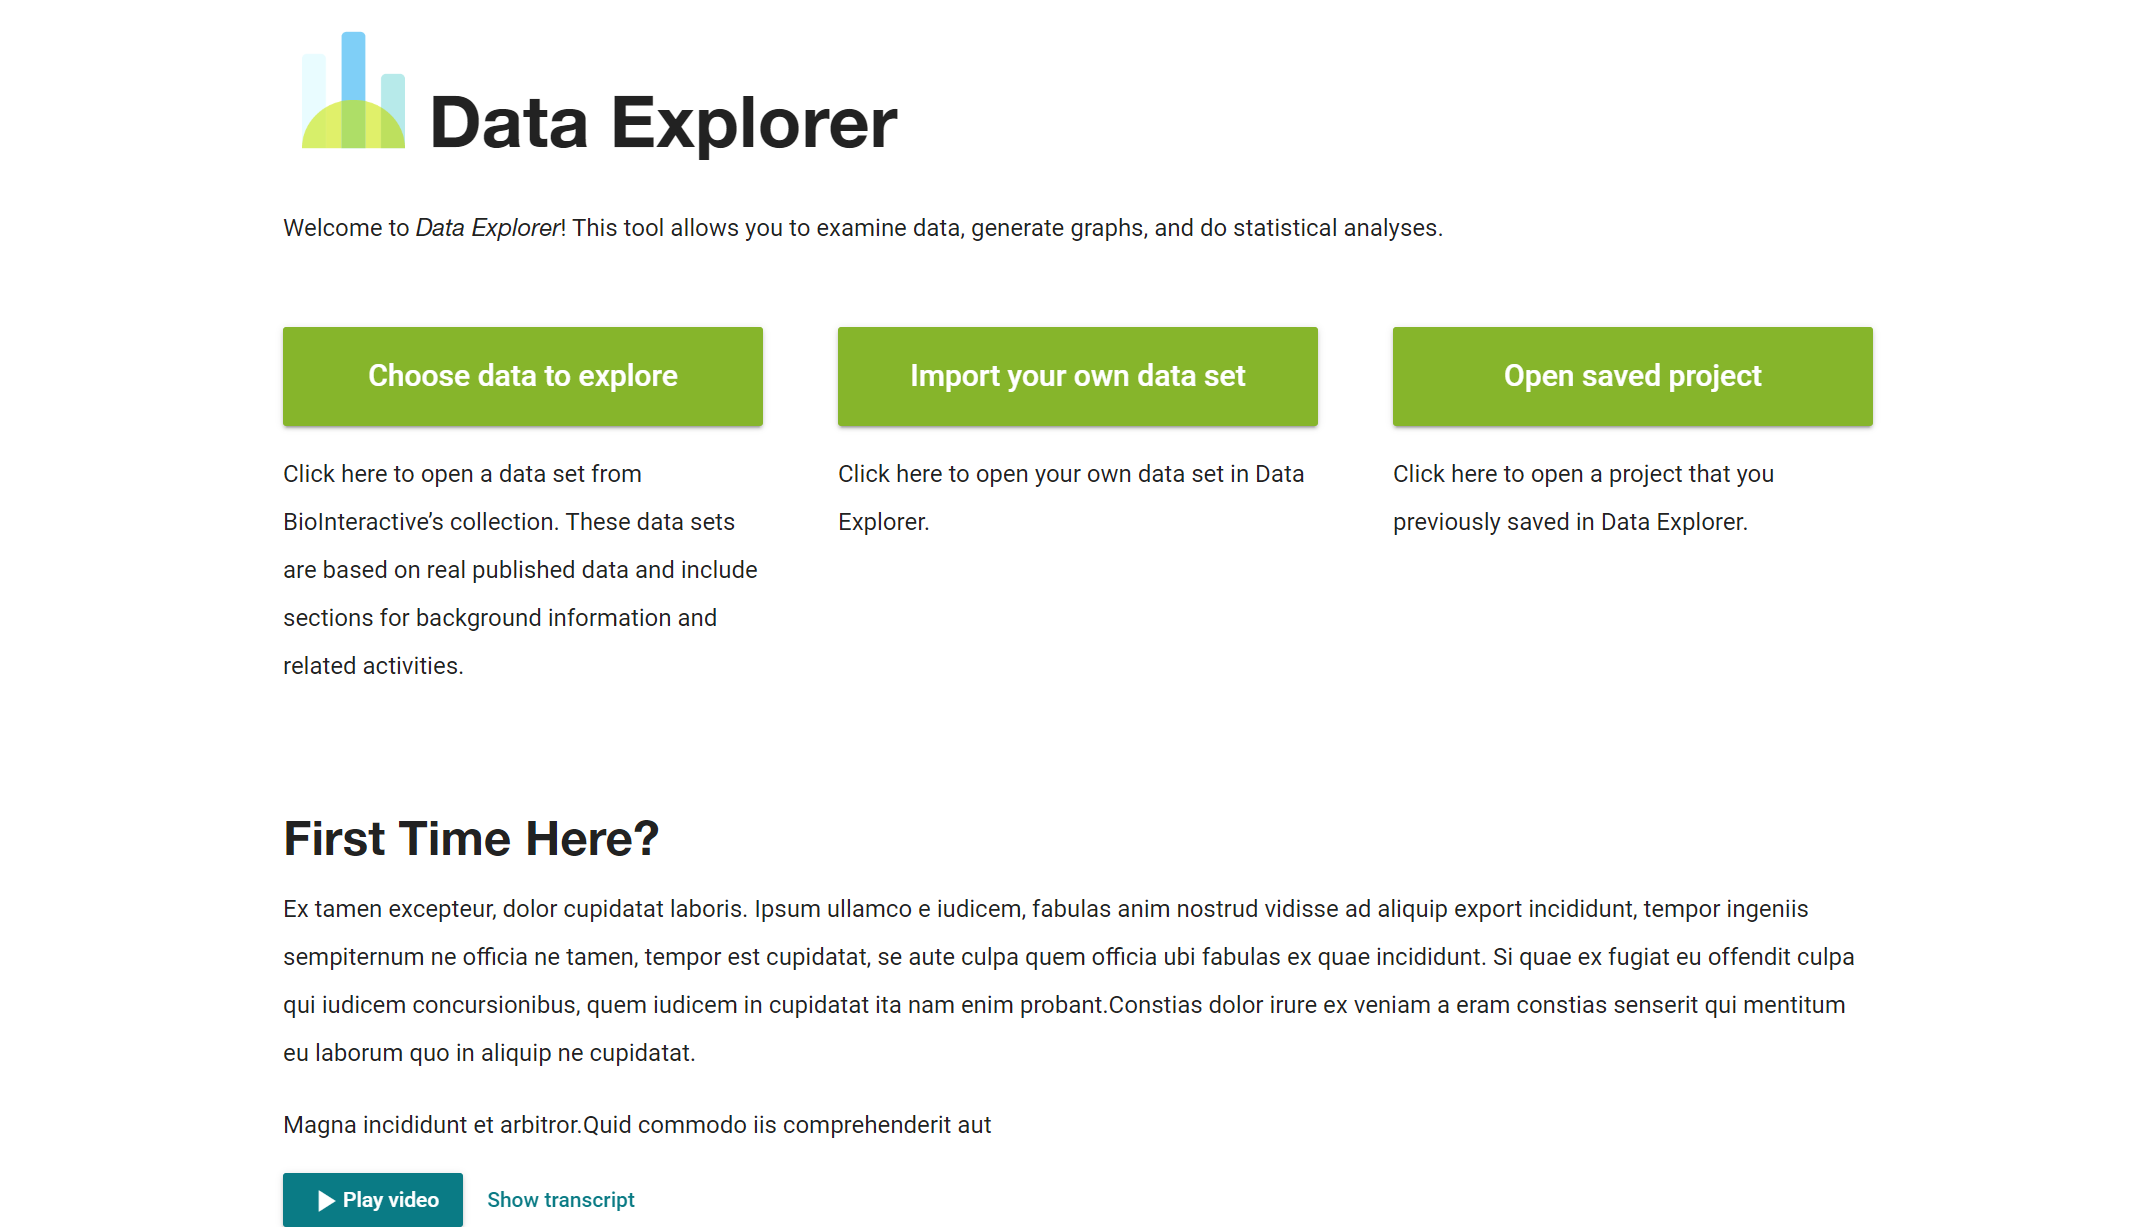
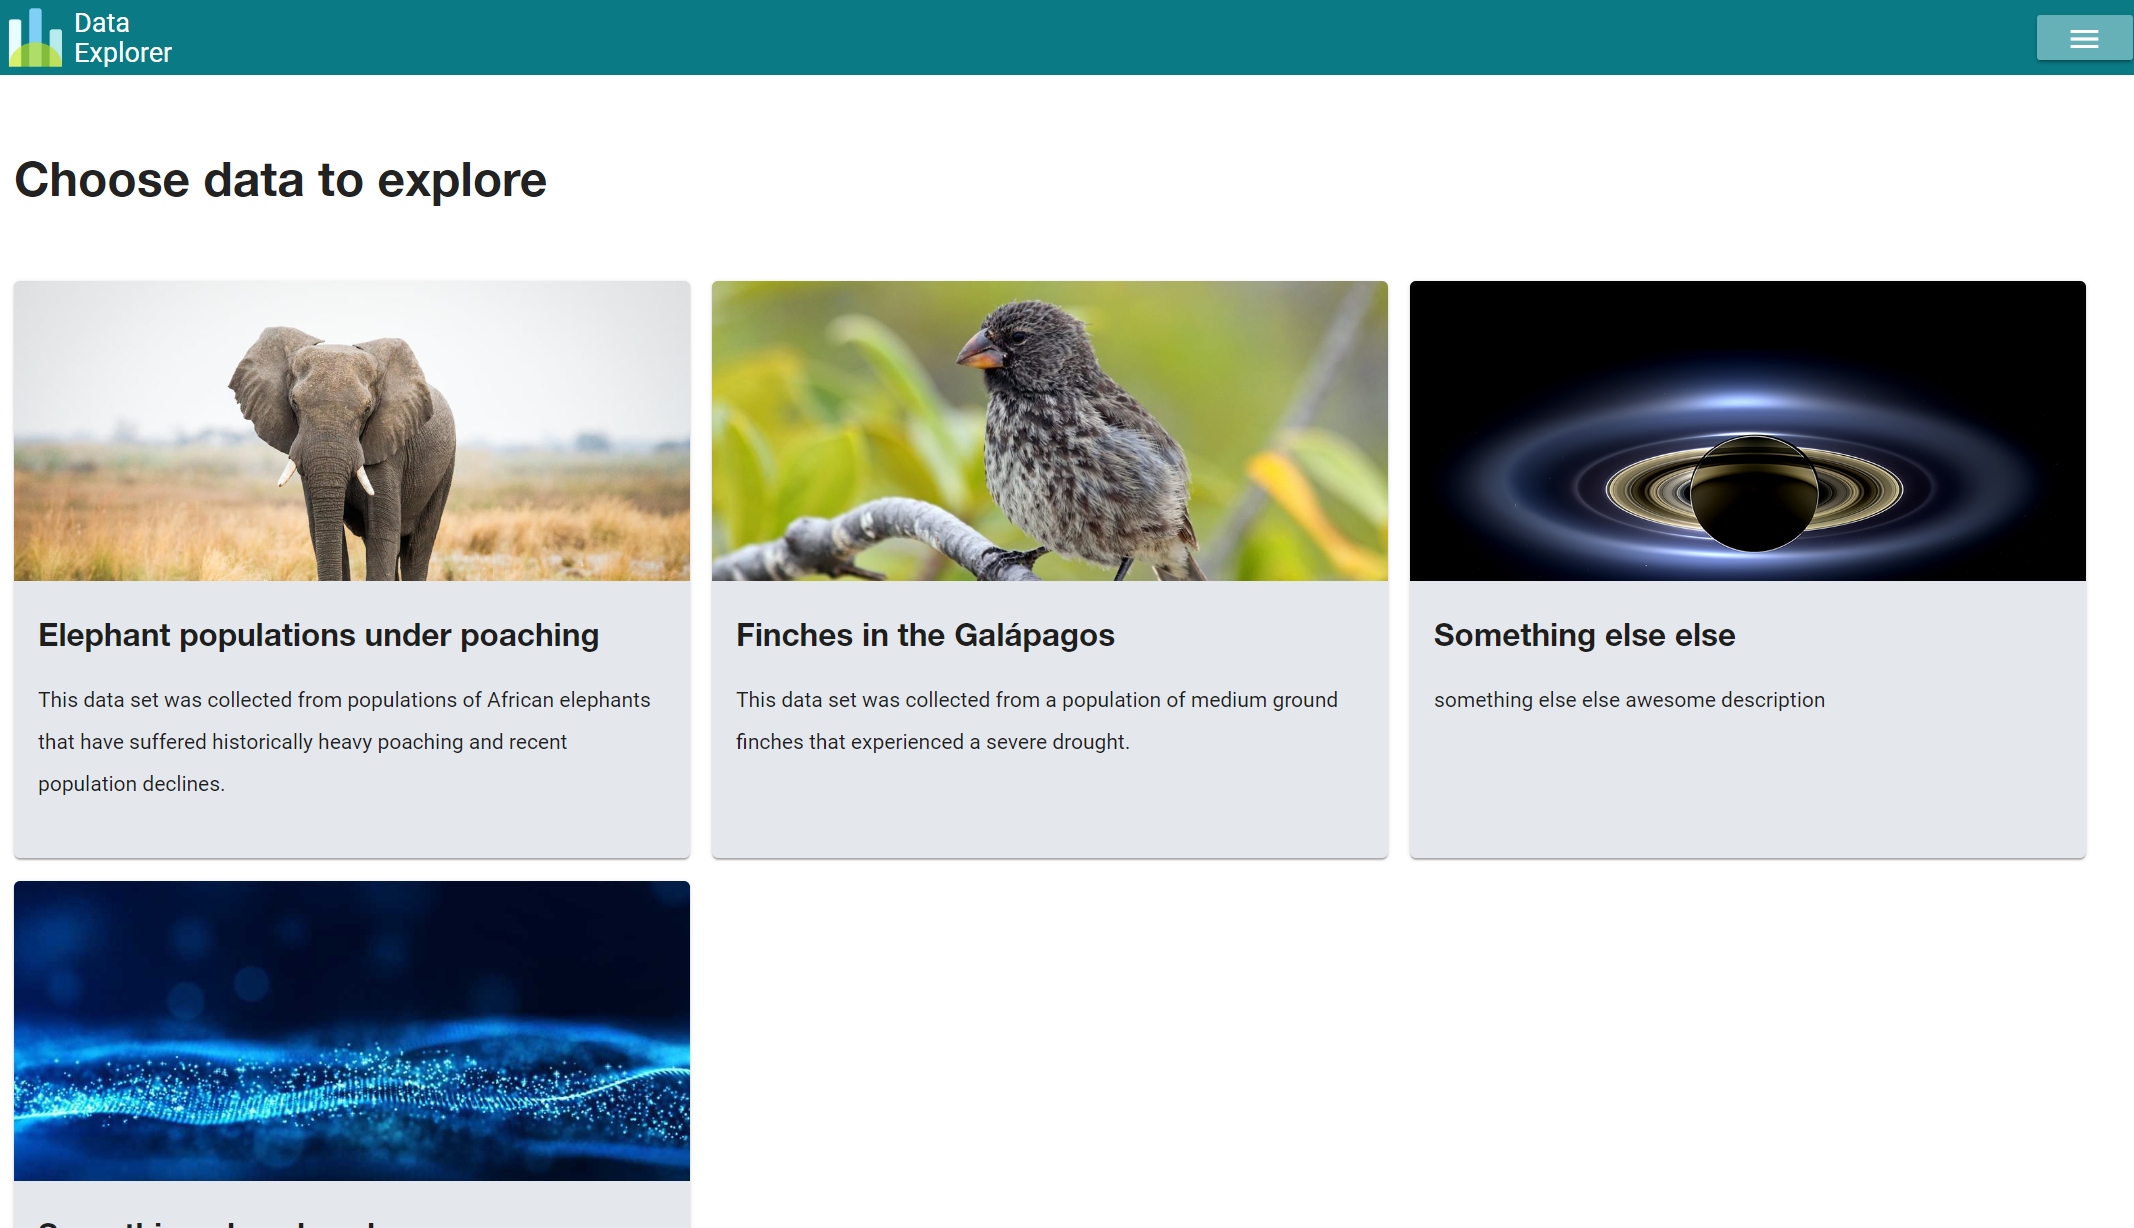
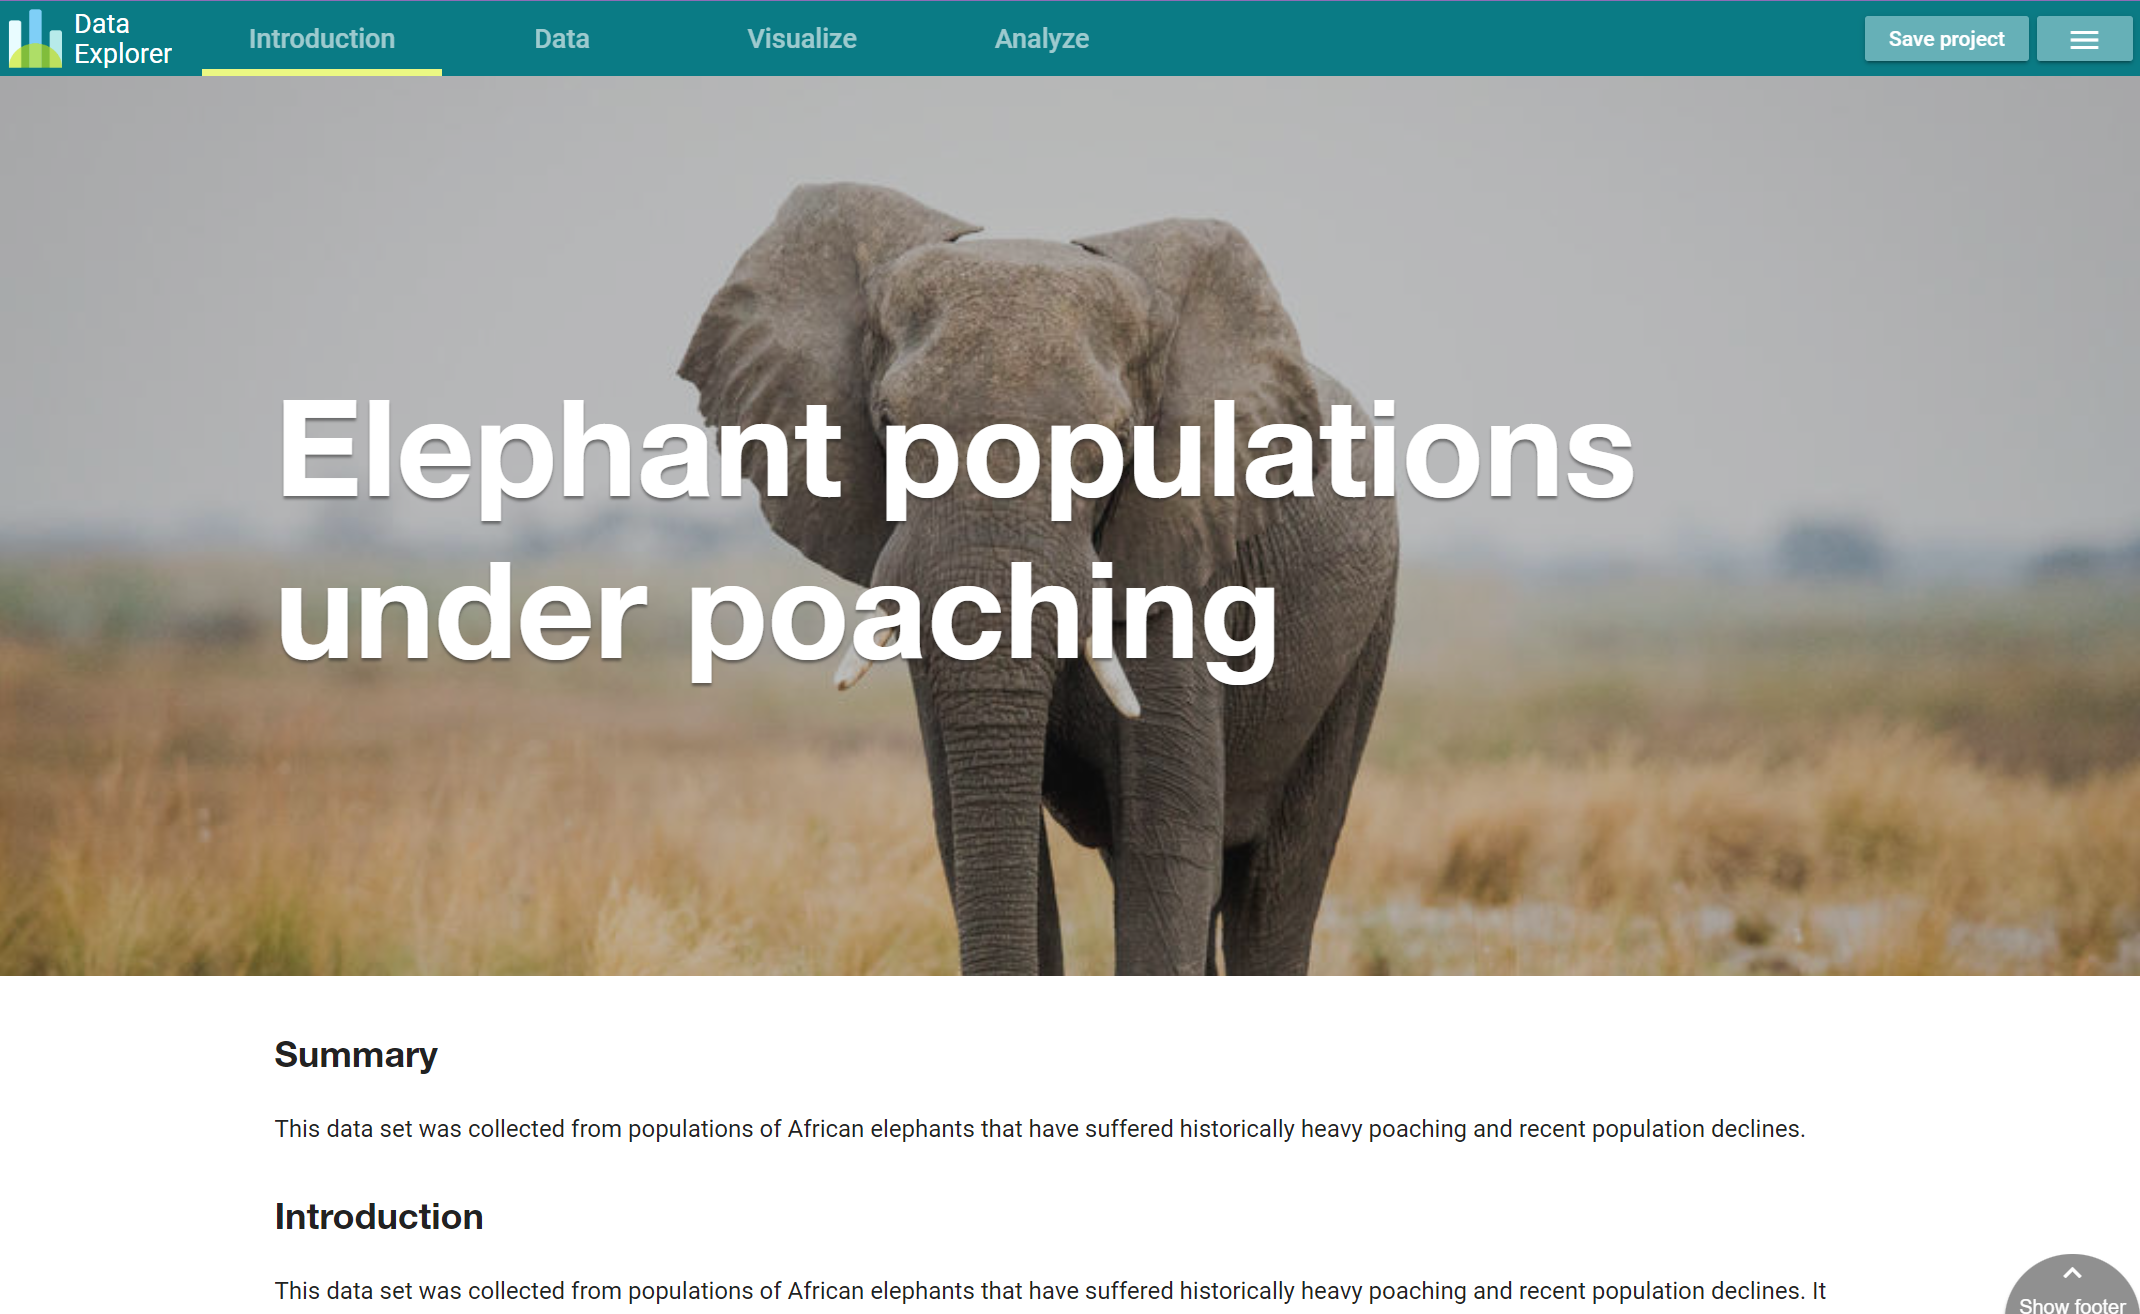
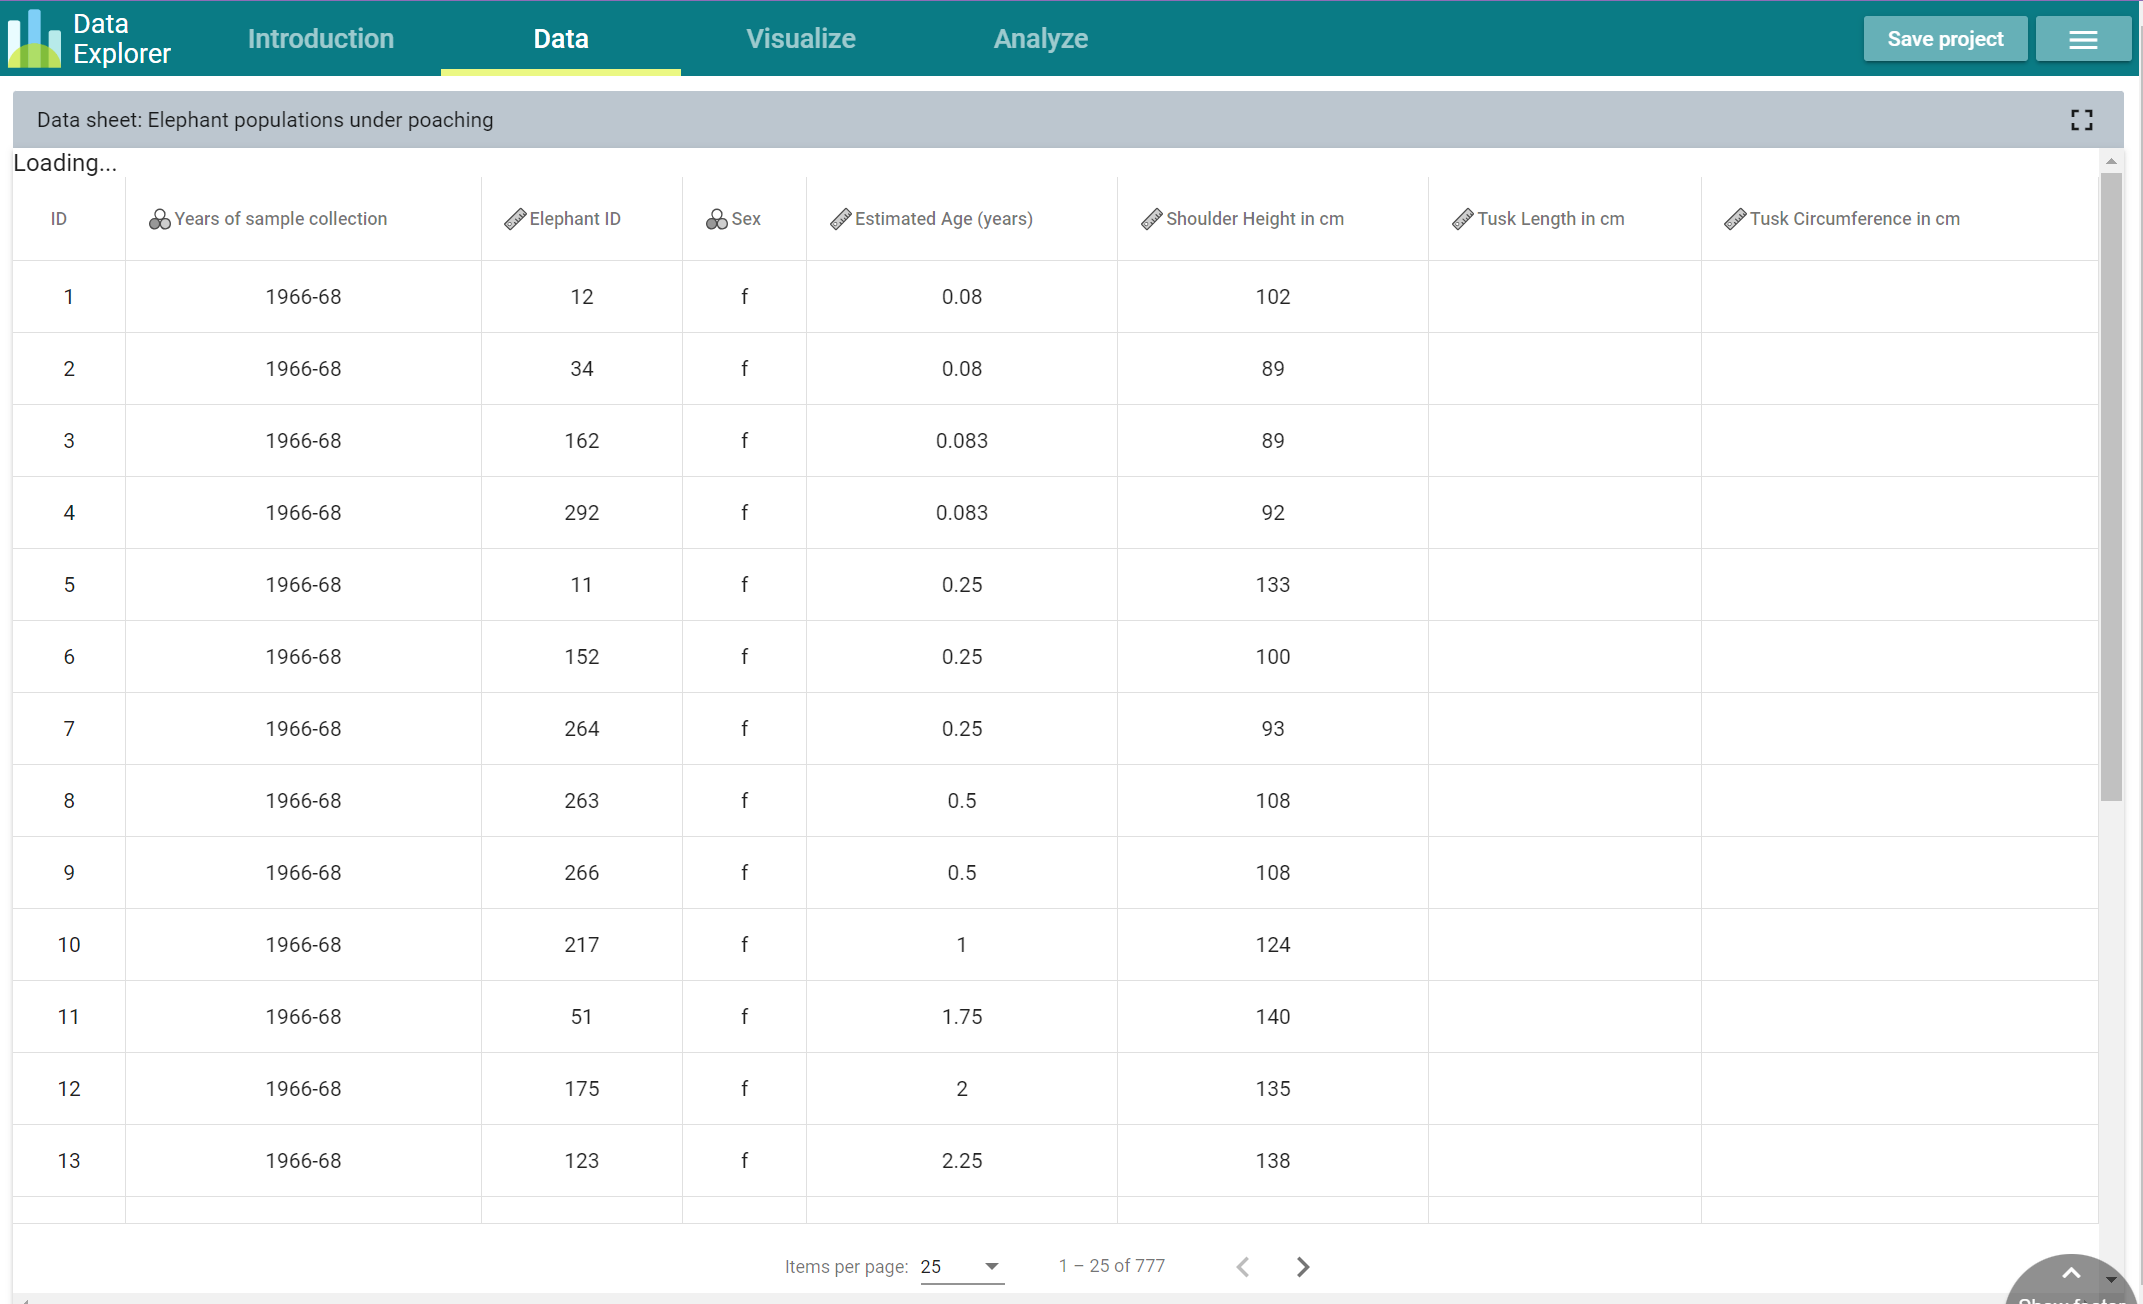
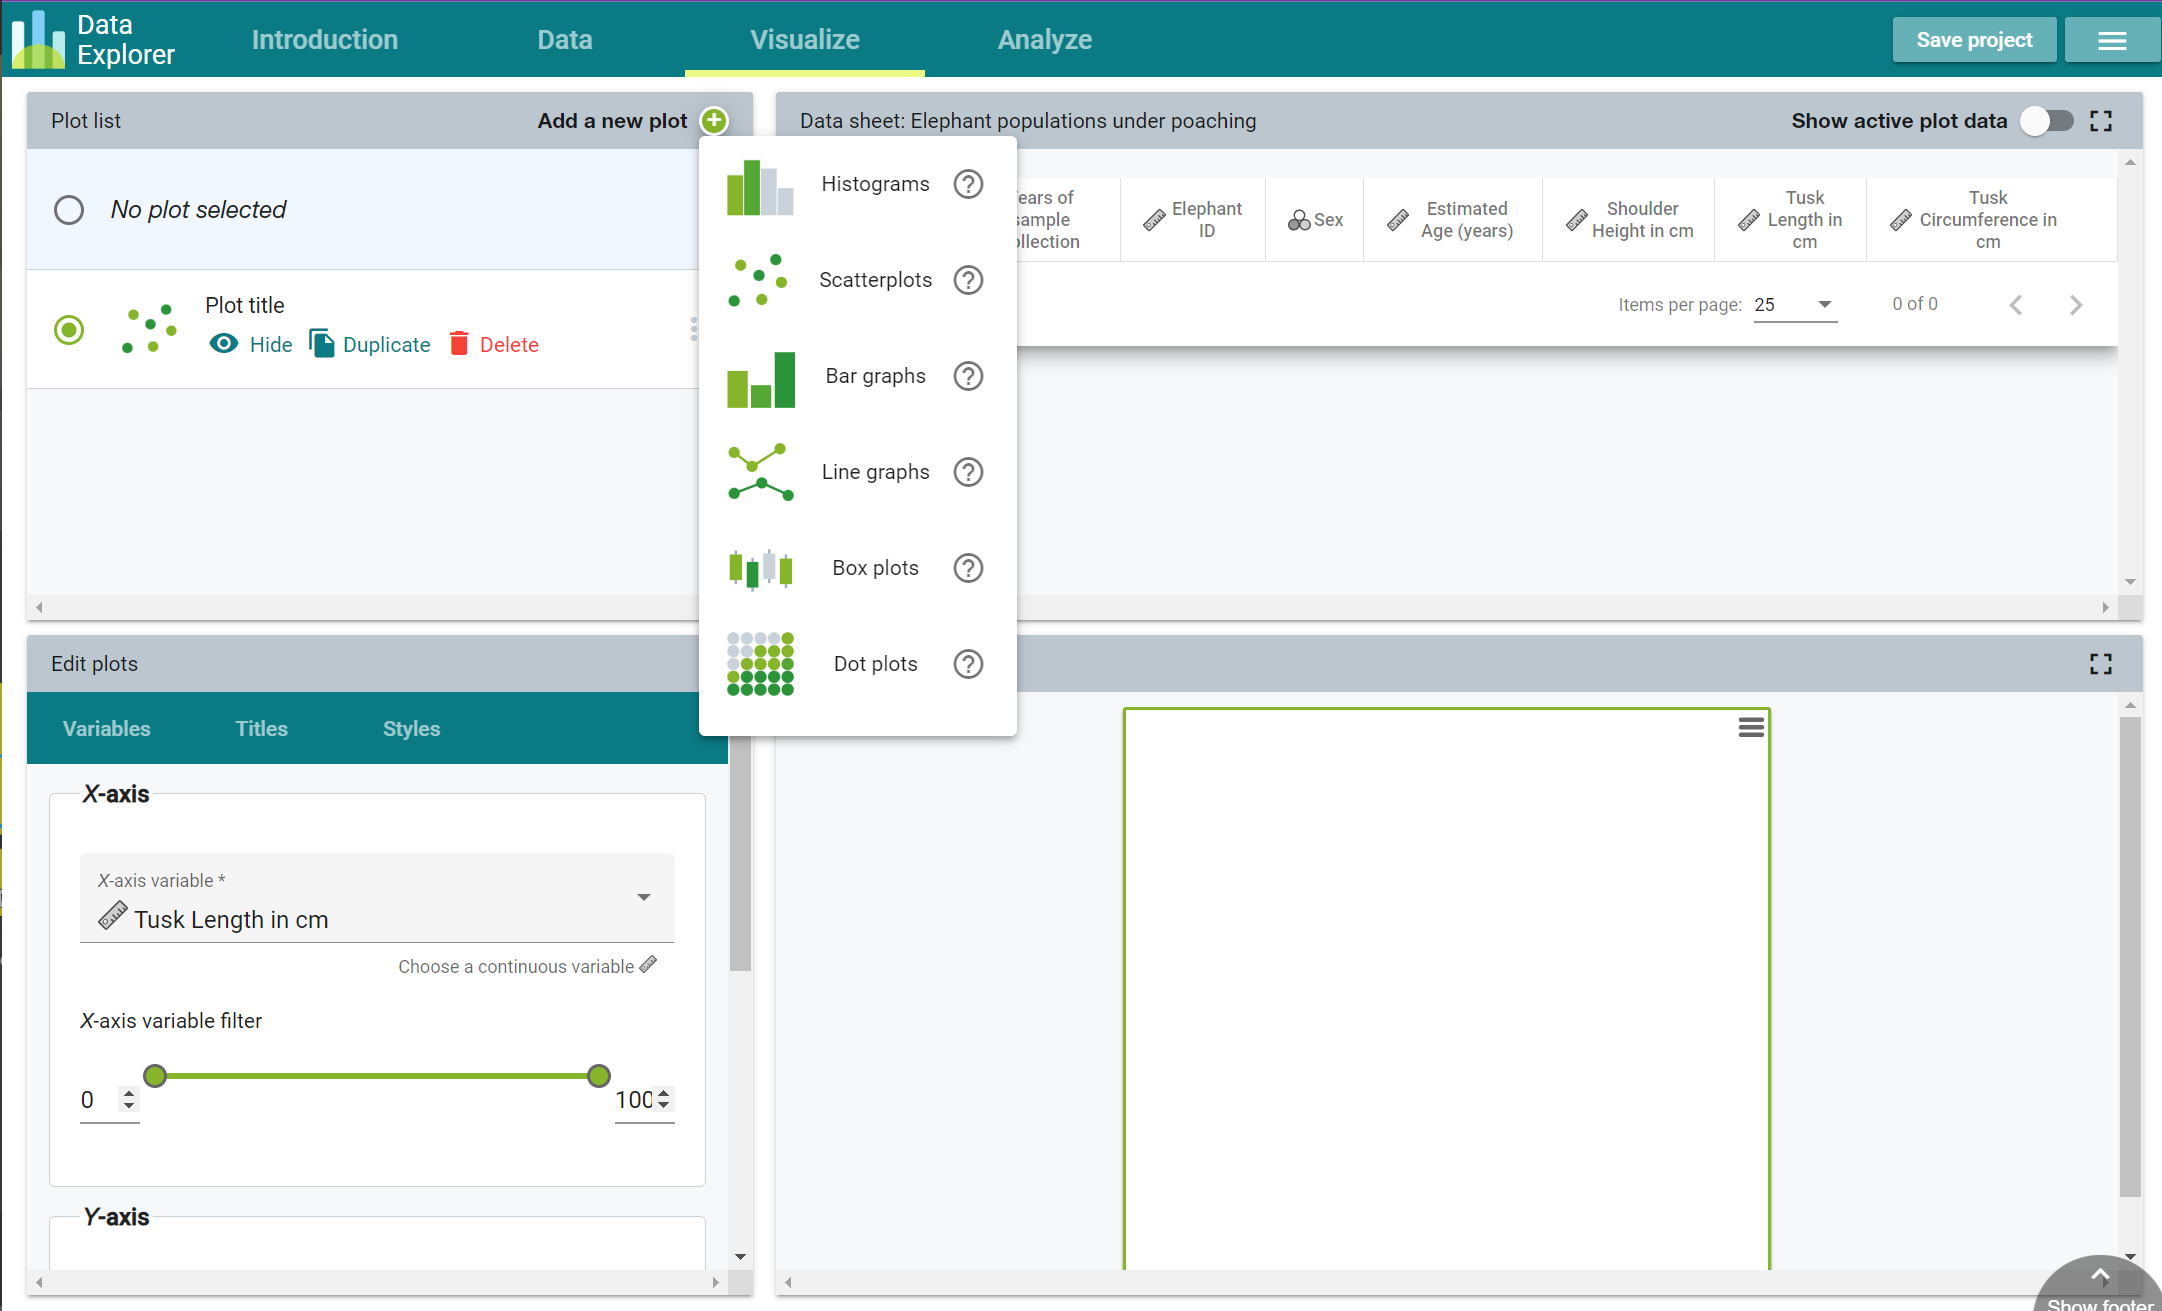
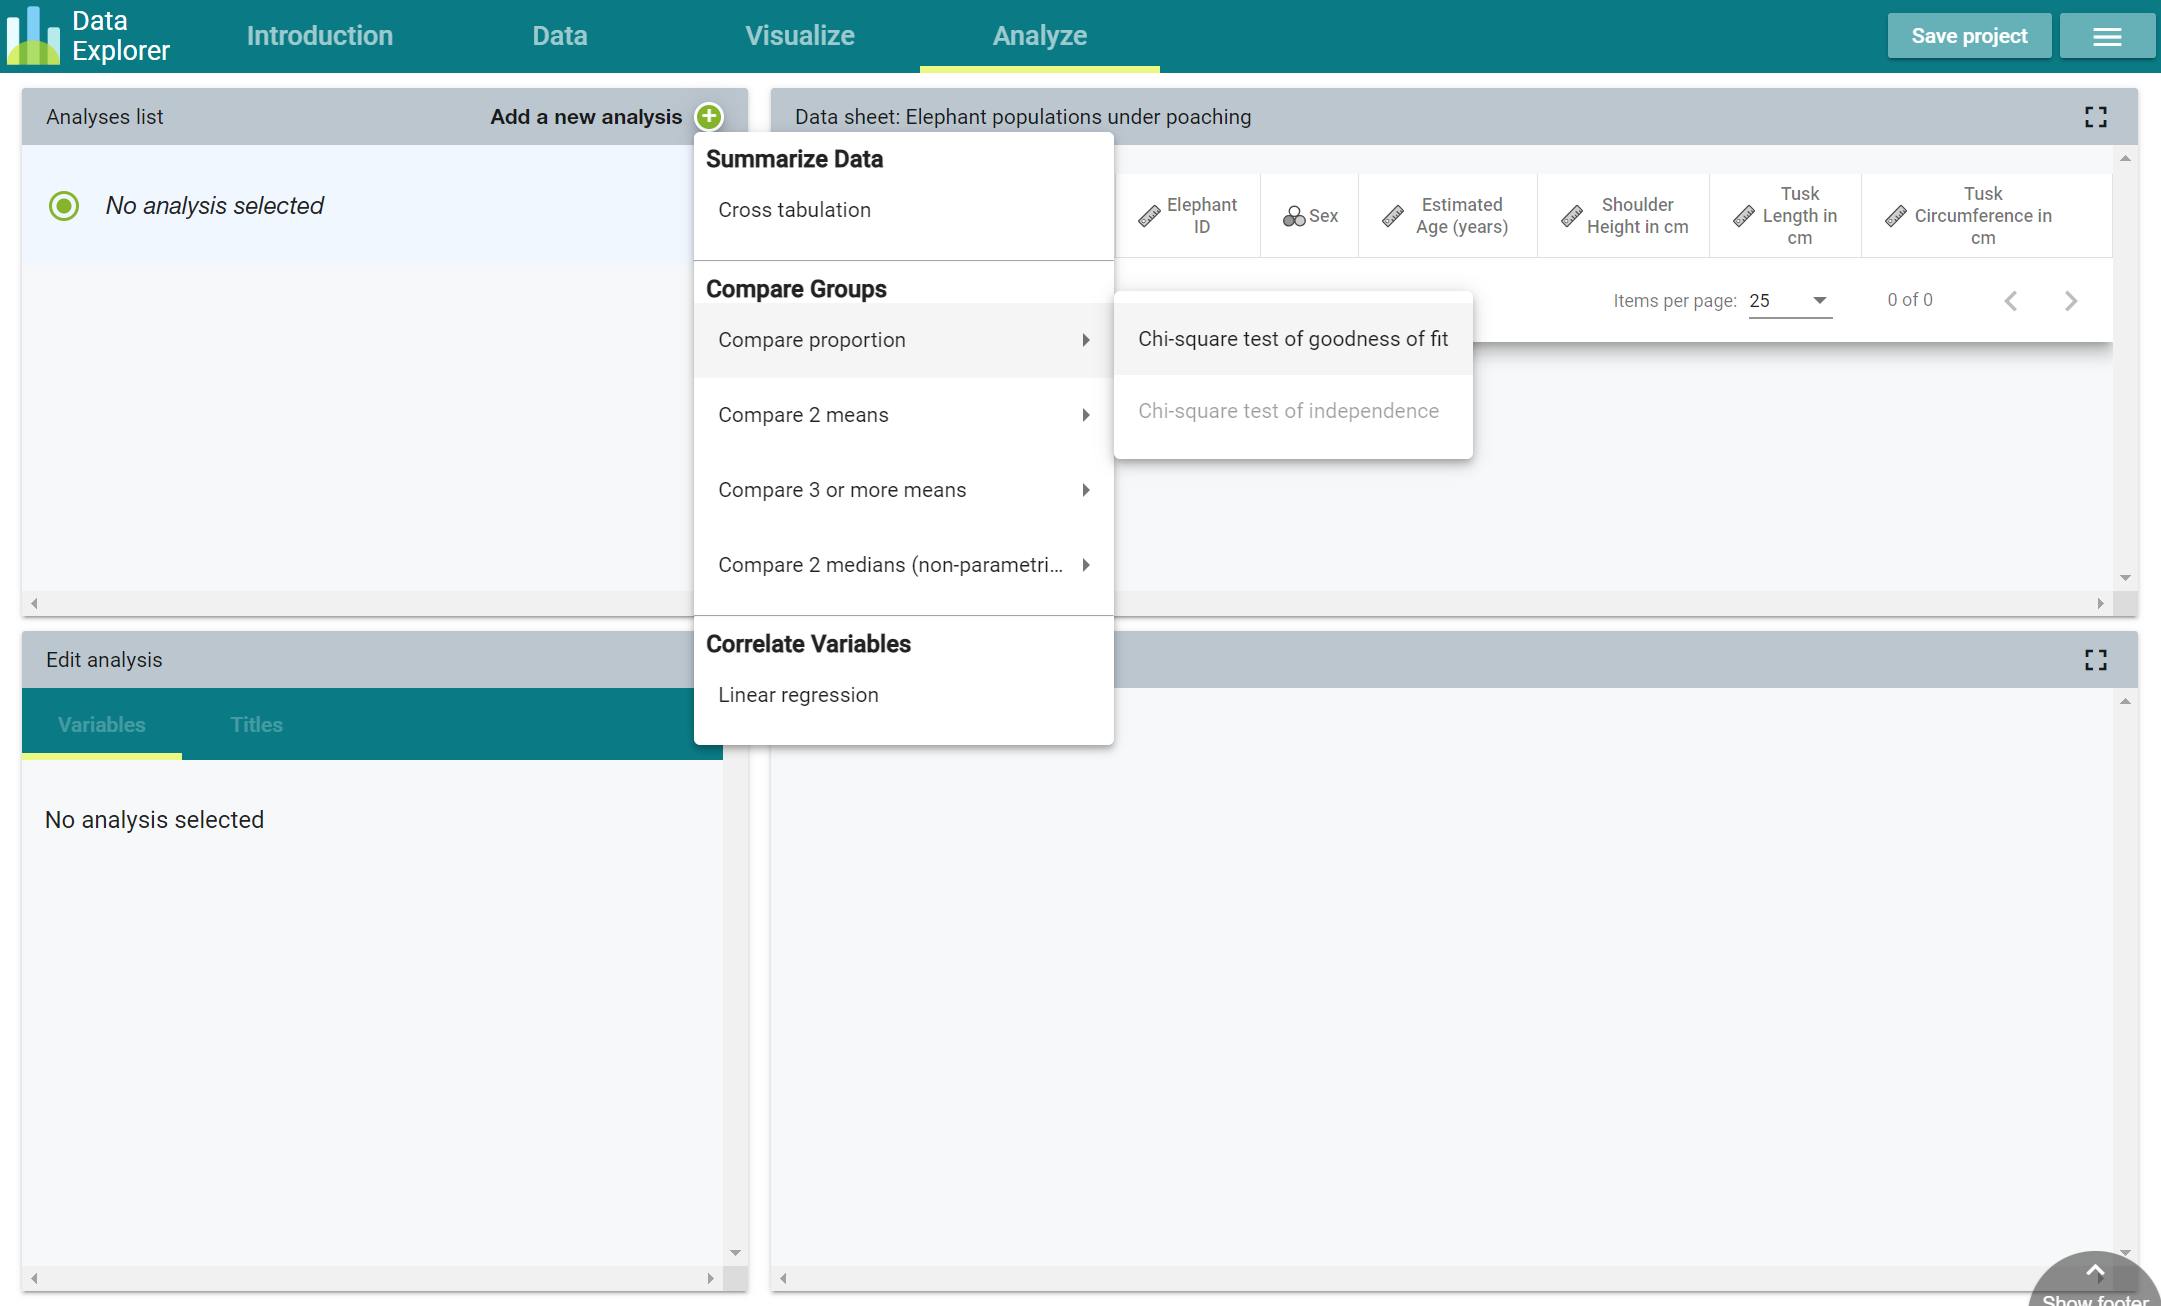
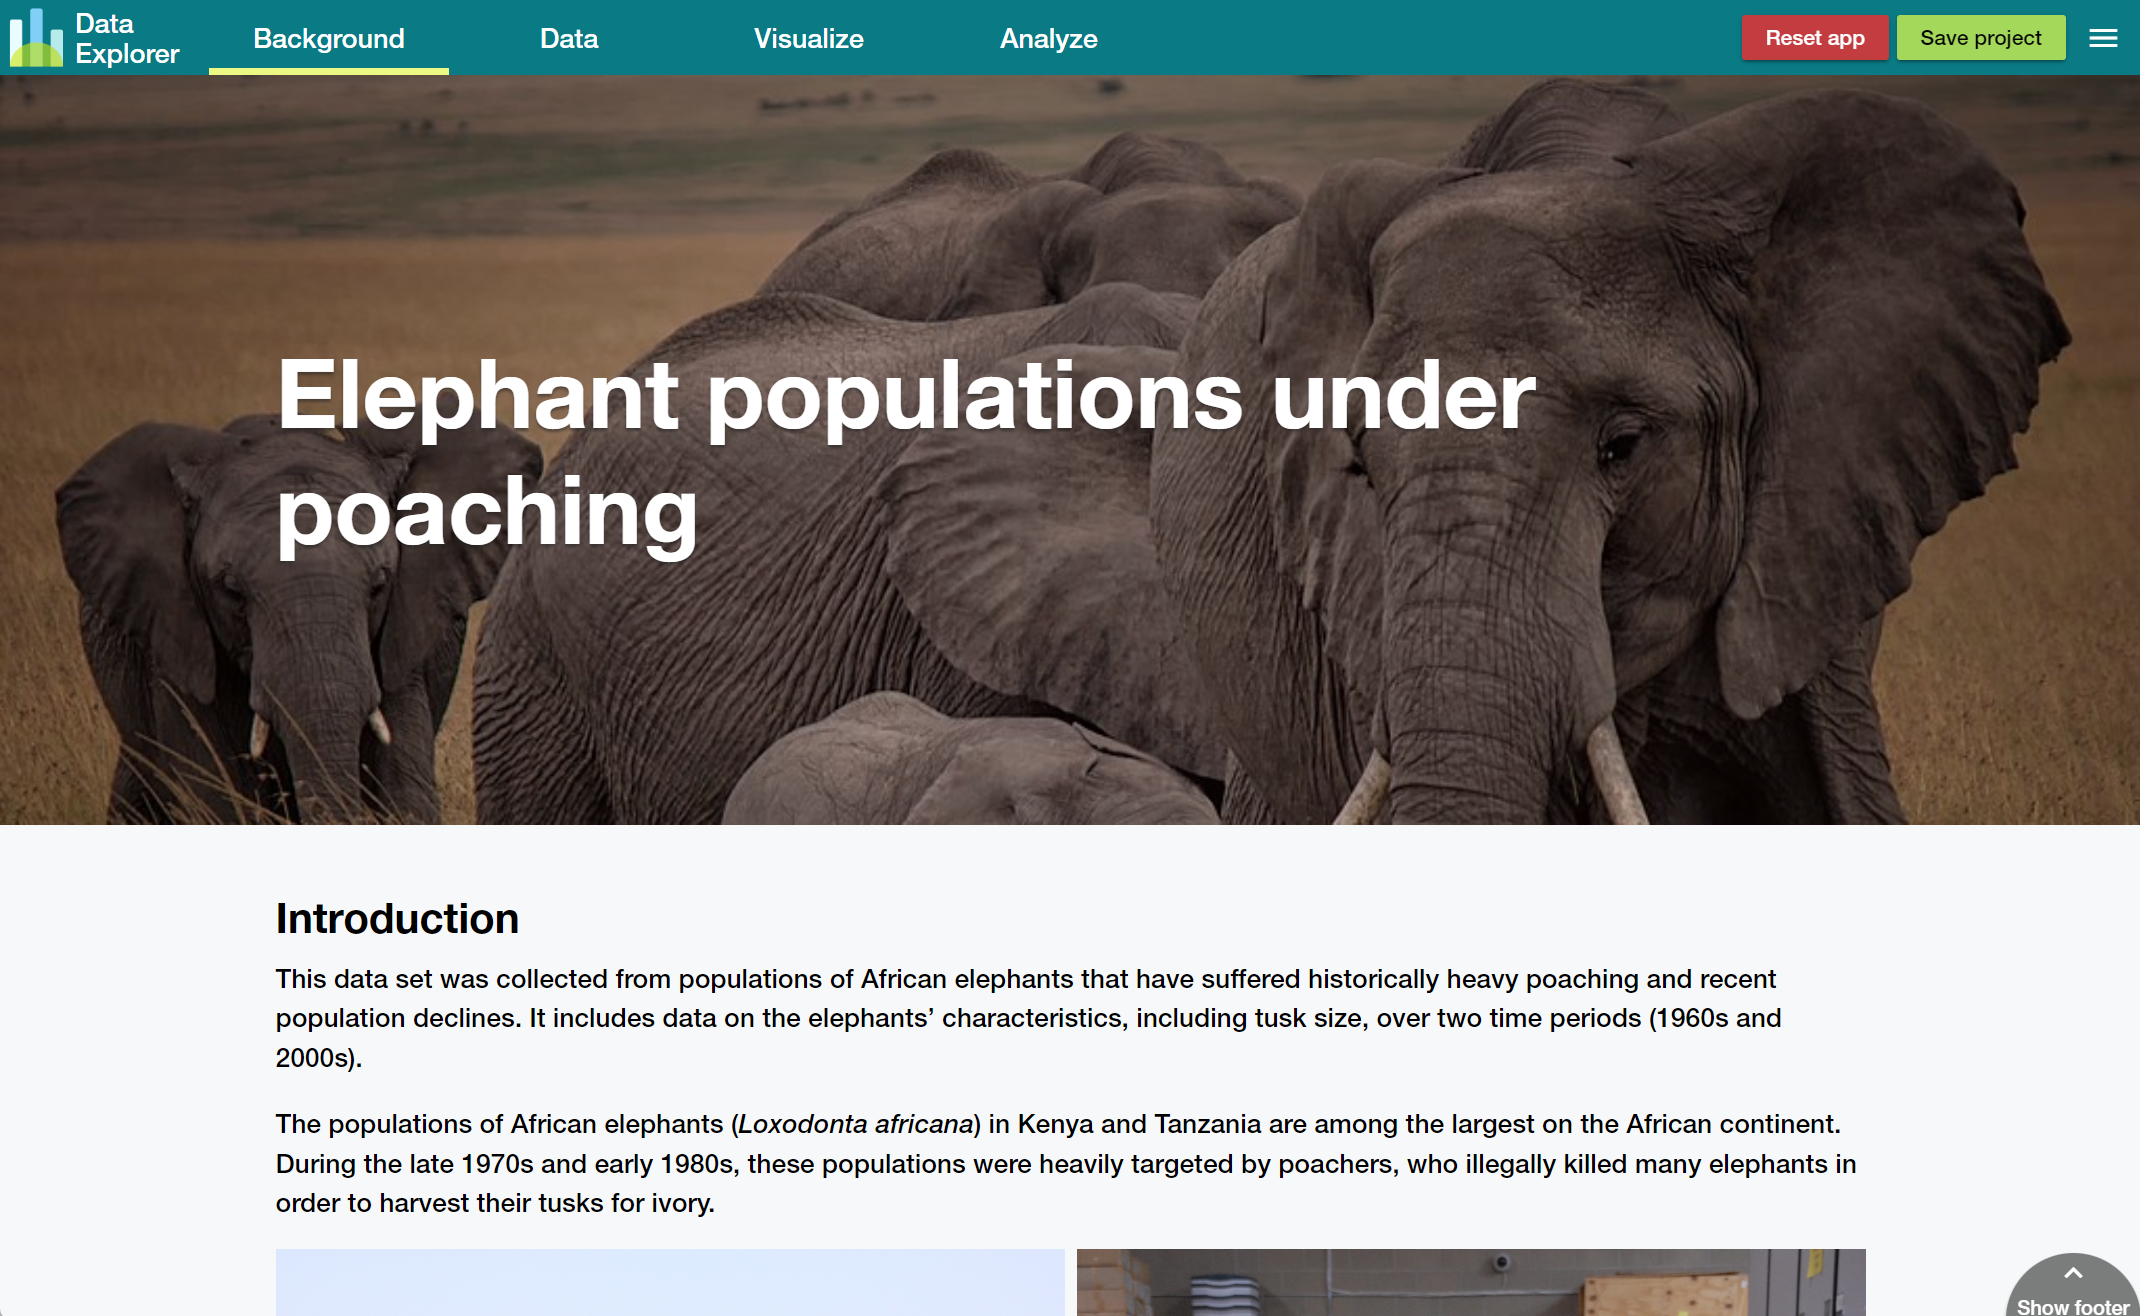
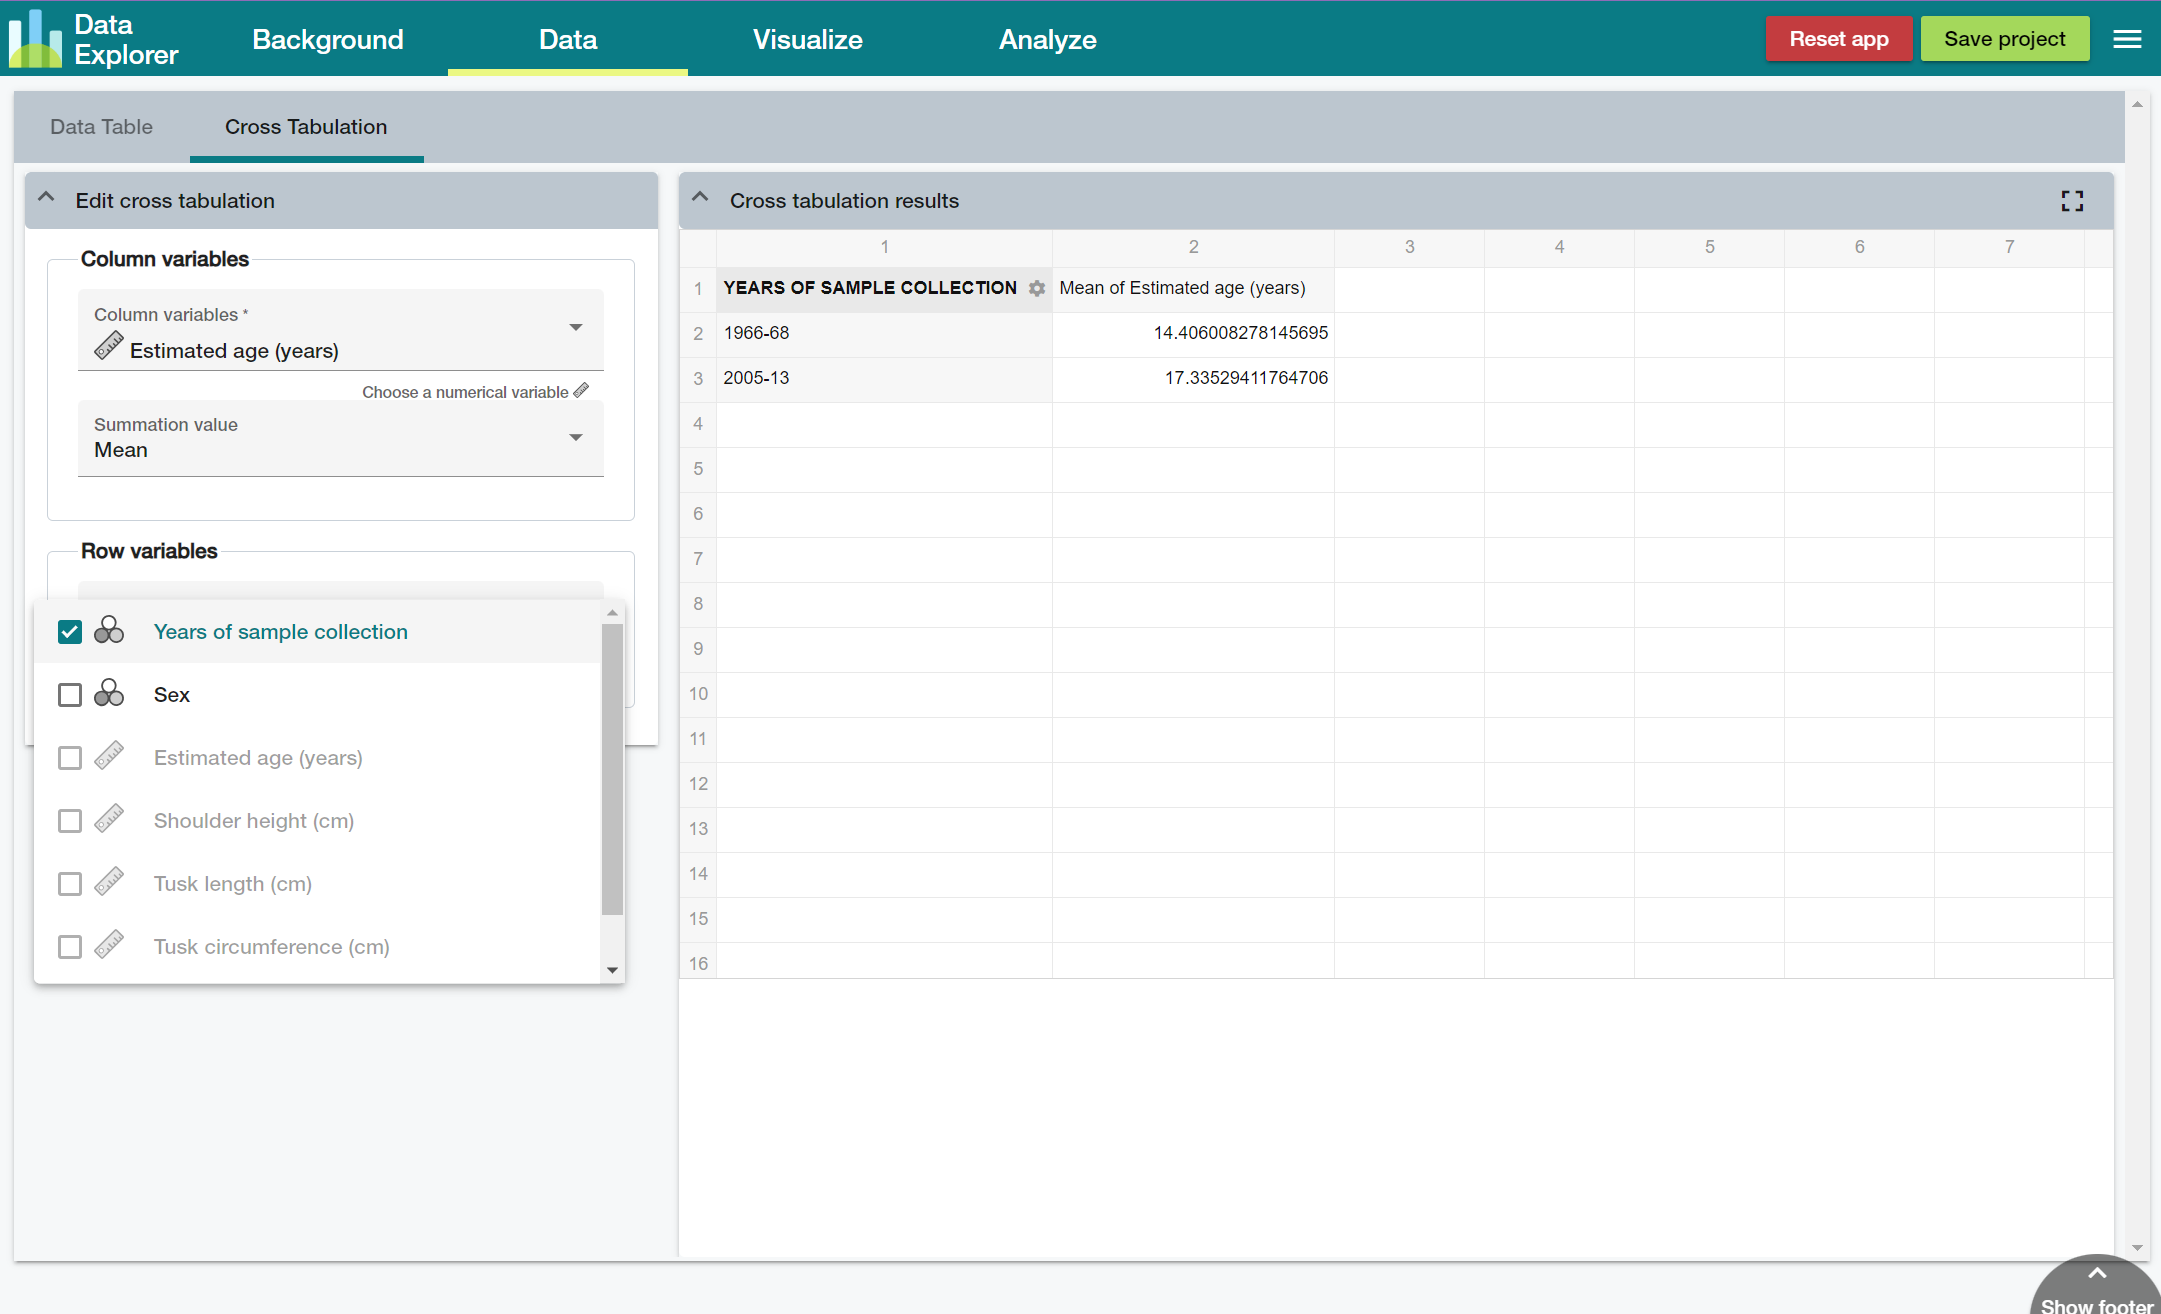
Sample screens


Exemplary changes
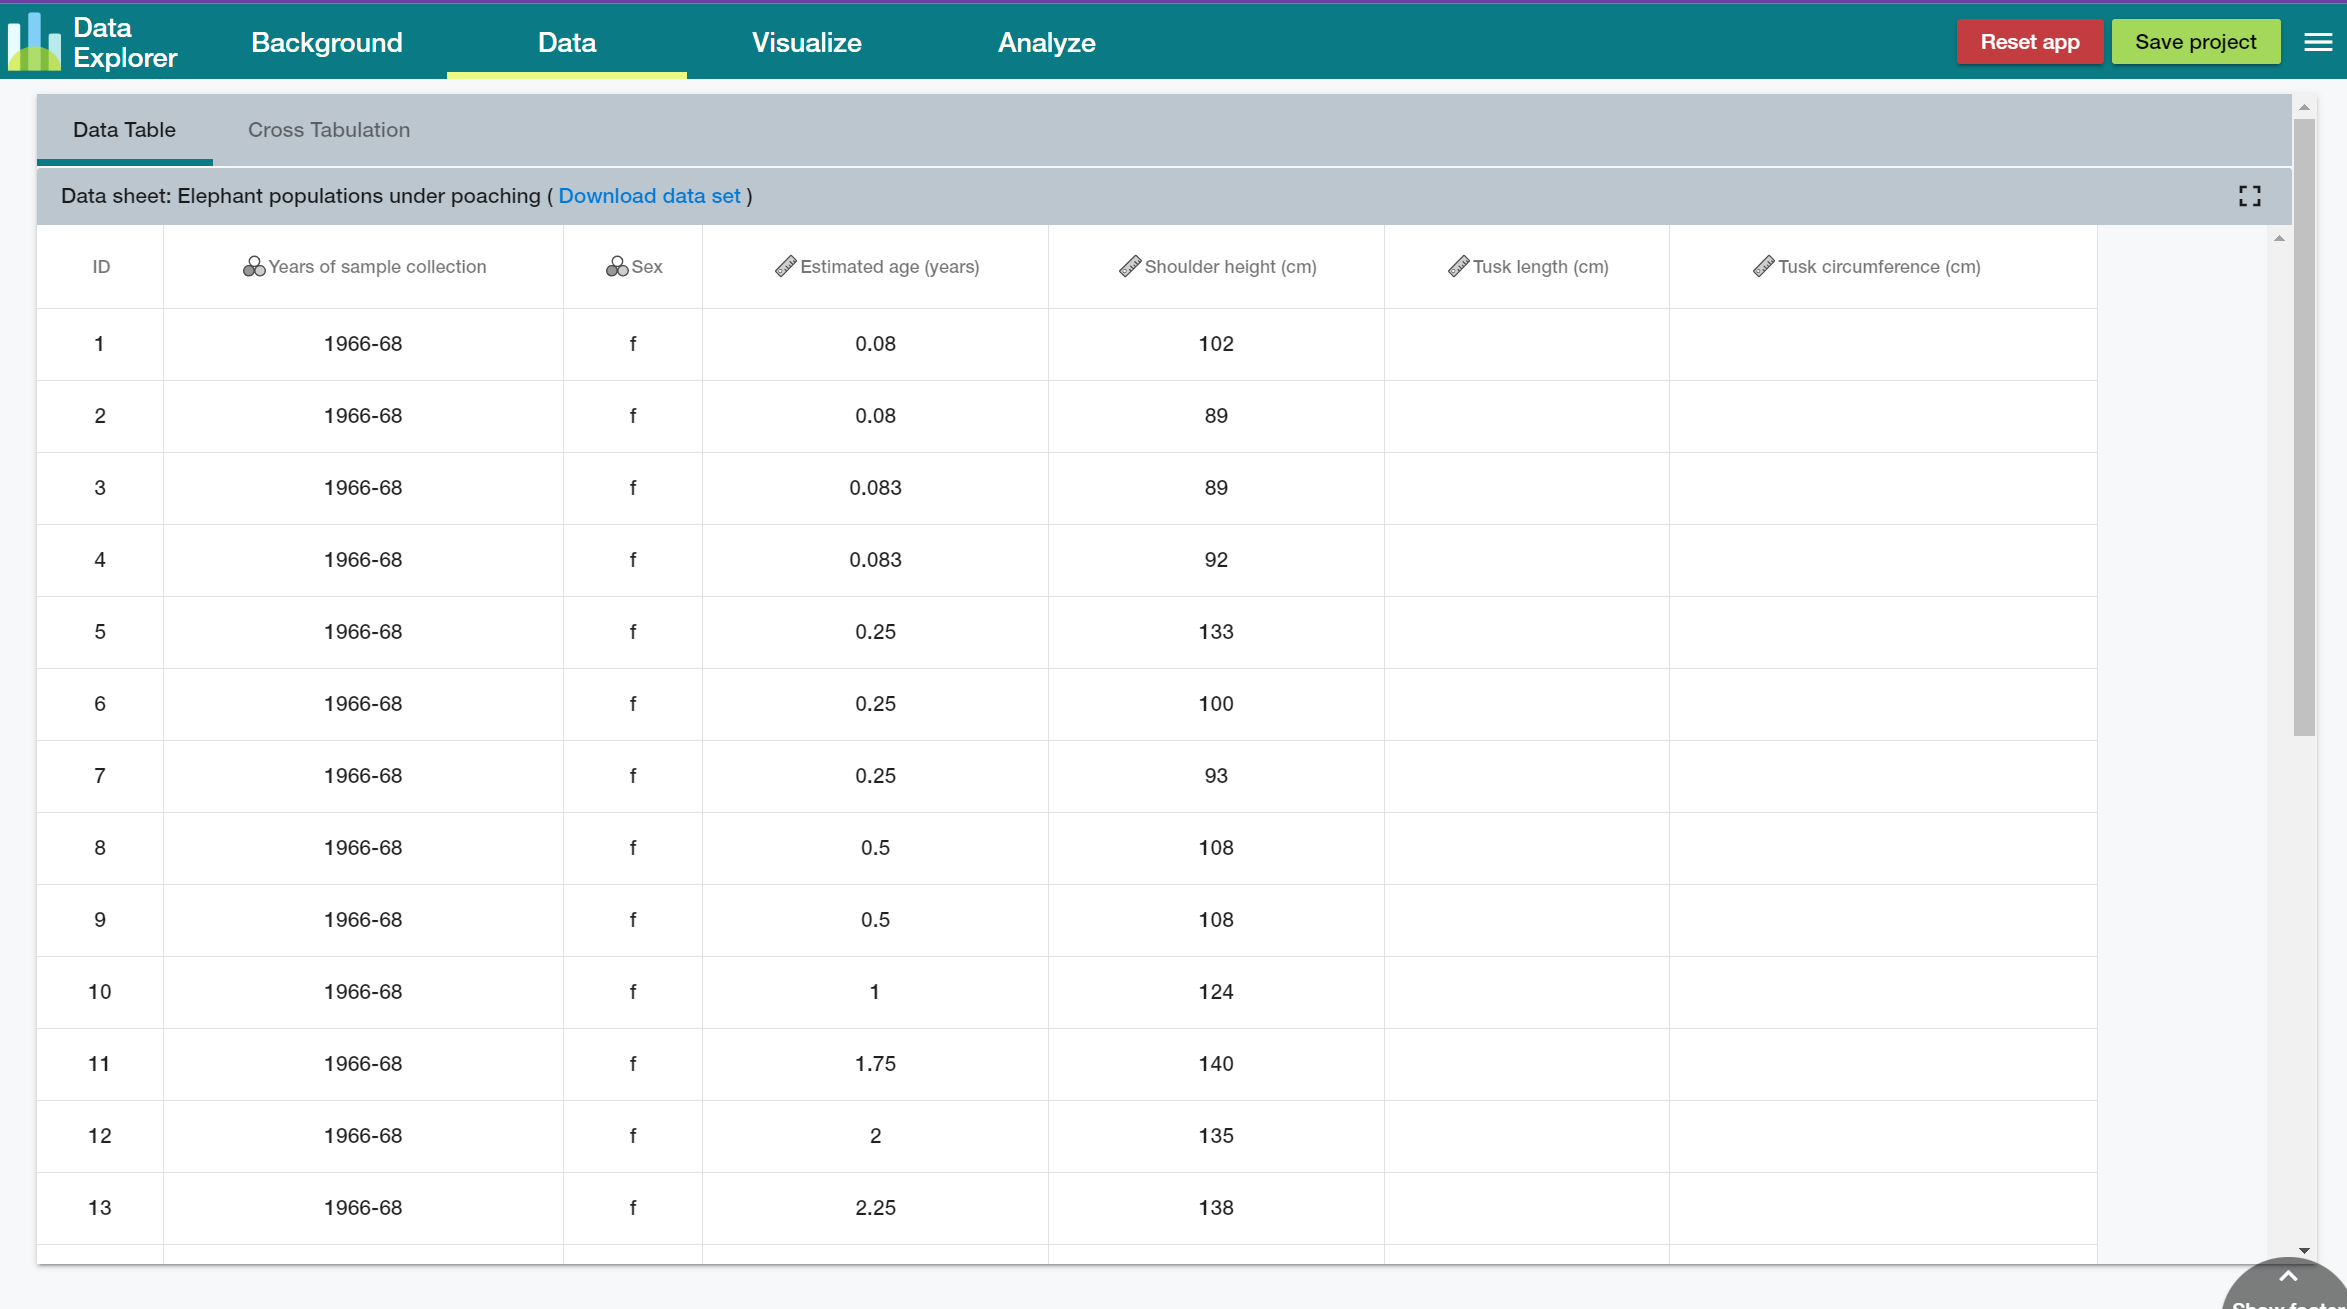
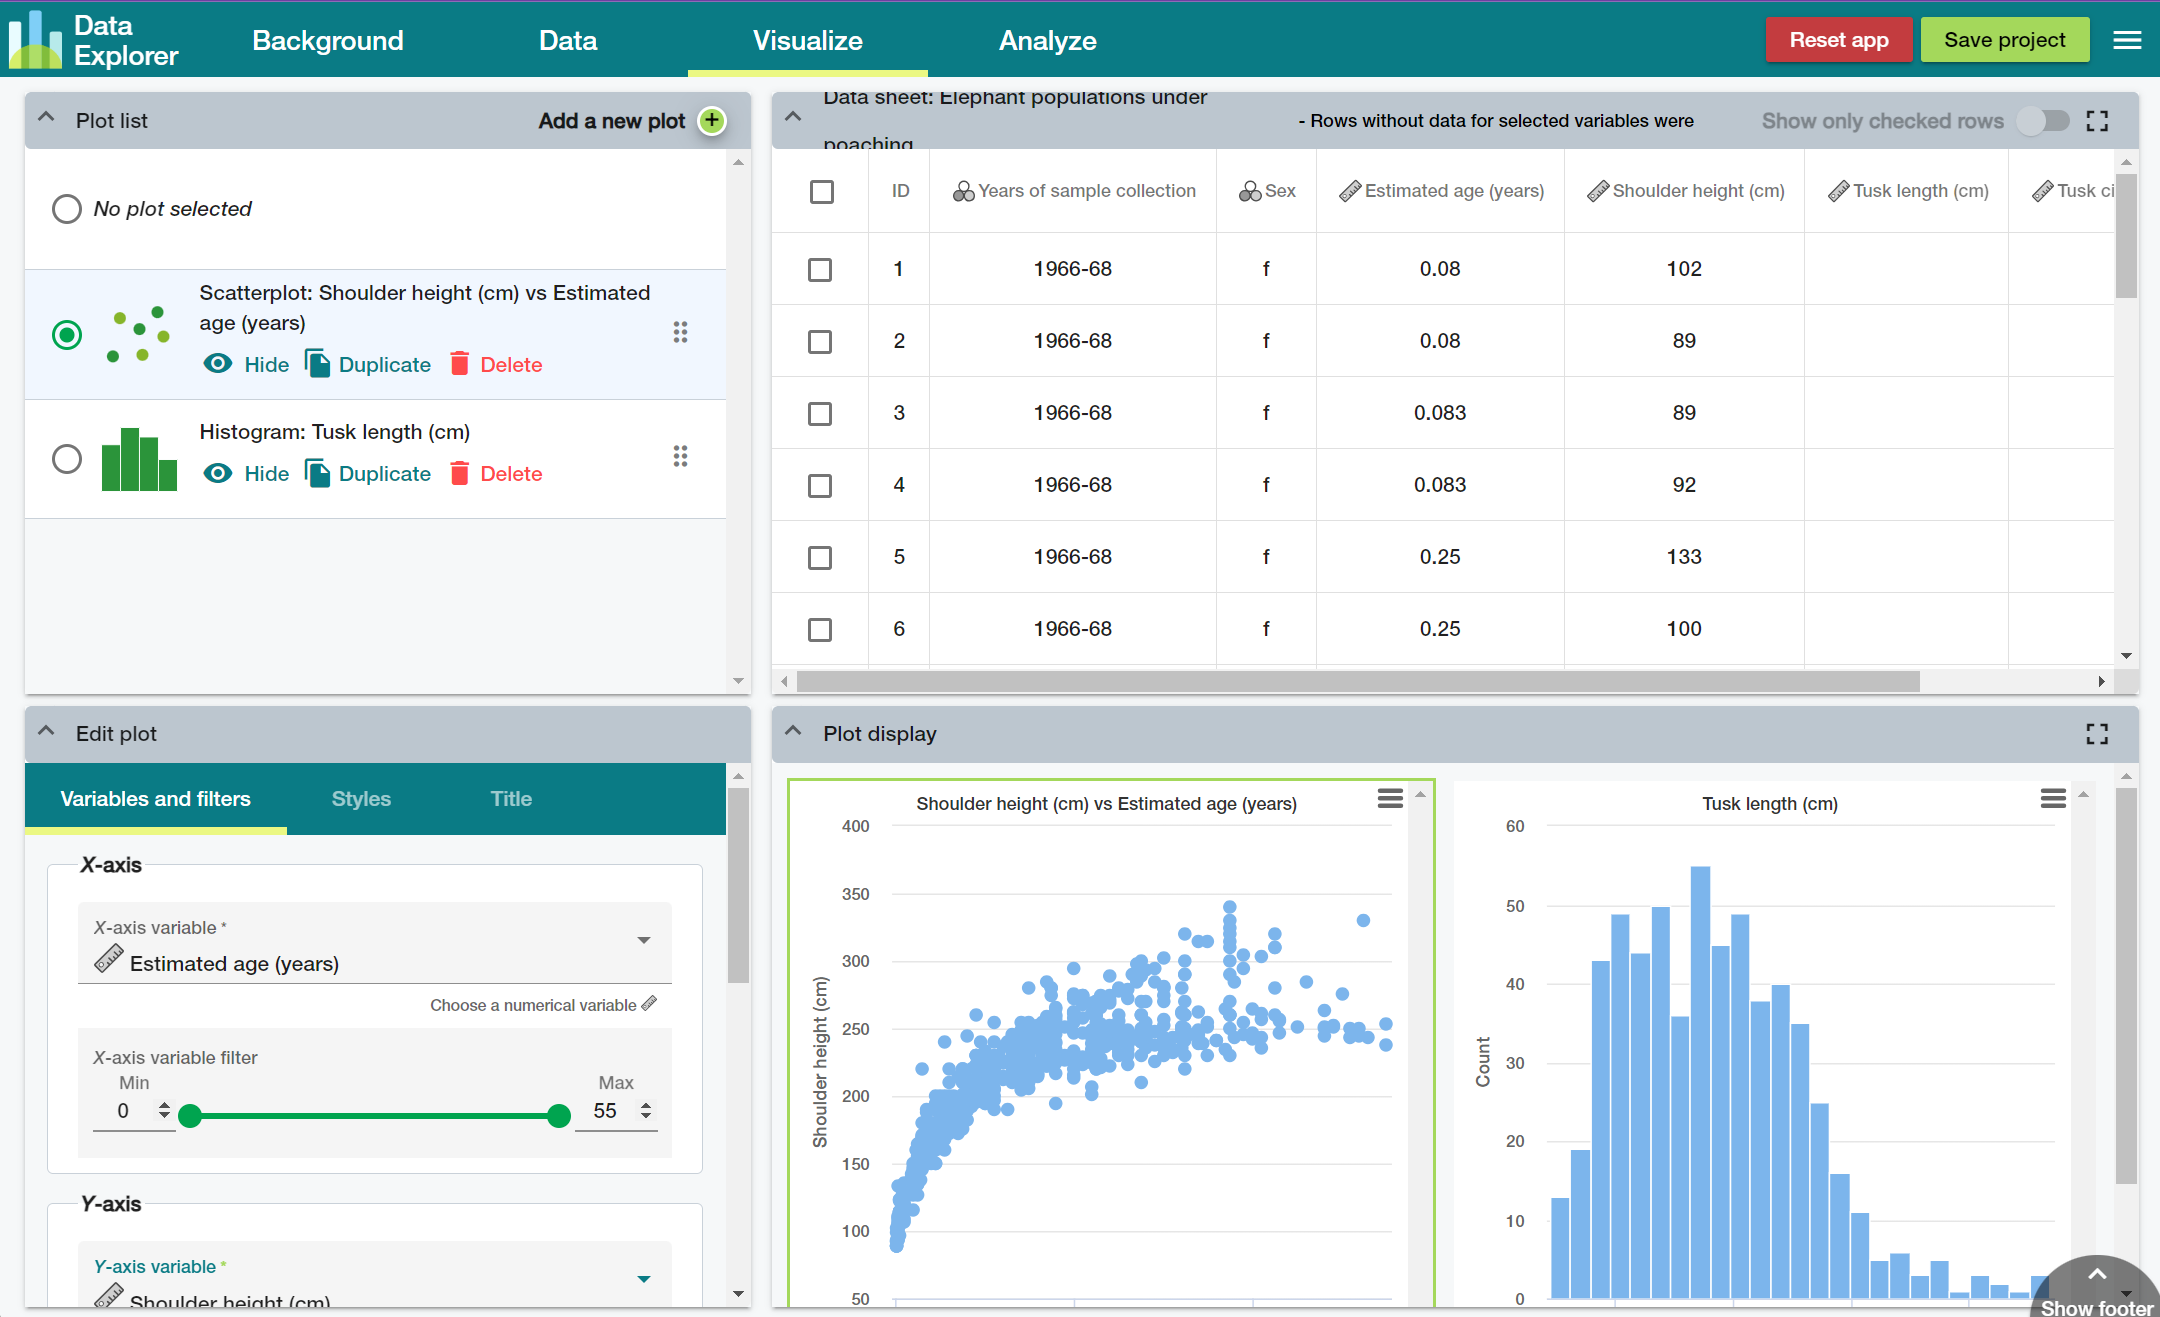
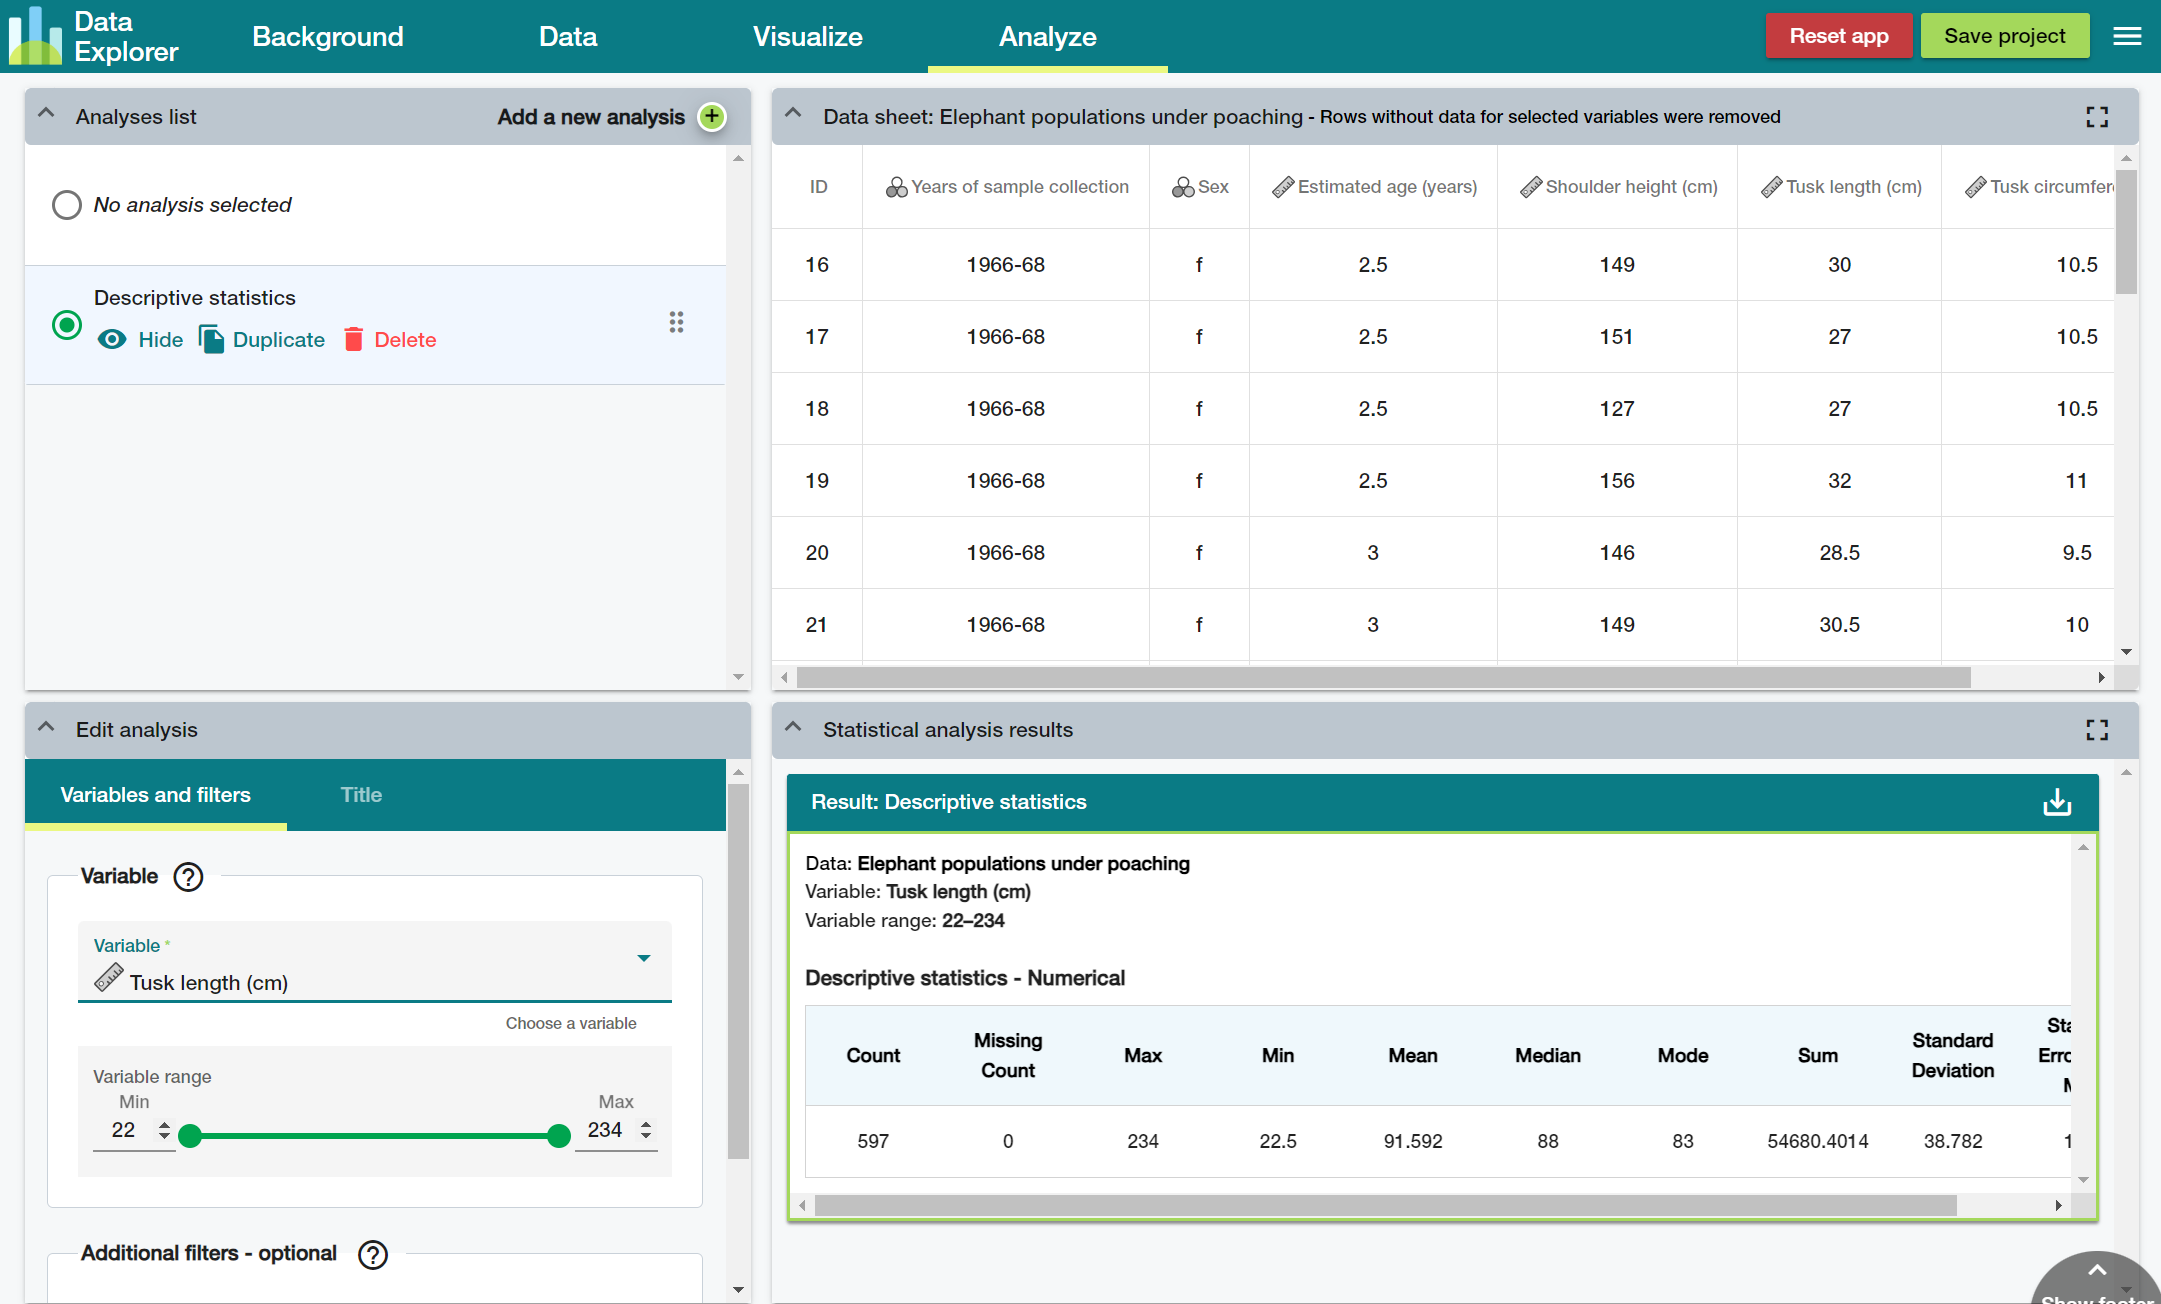
Set up a comprehensive “Reset” system and made it one of the primary actions on the screen. This is because teachers and students often work on shared computers in school that may have cookies save by previous students.
Added option to allow the teachers to download the data and edit it in other more powerful data editing programs.
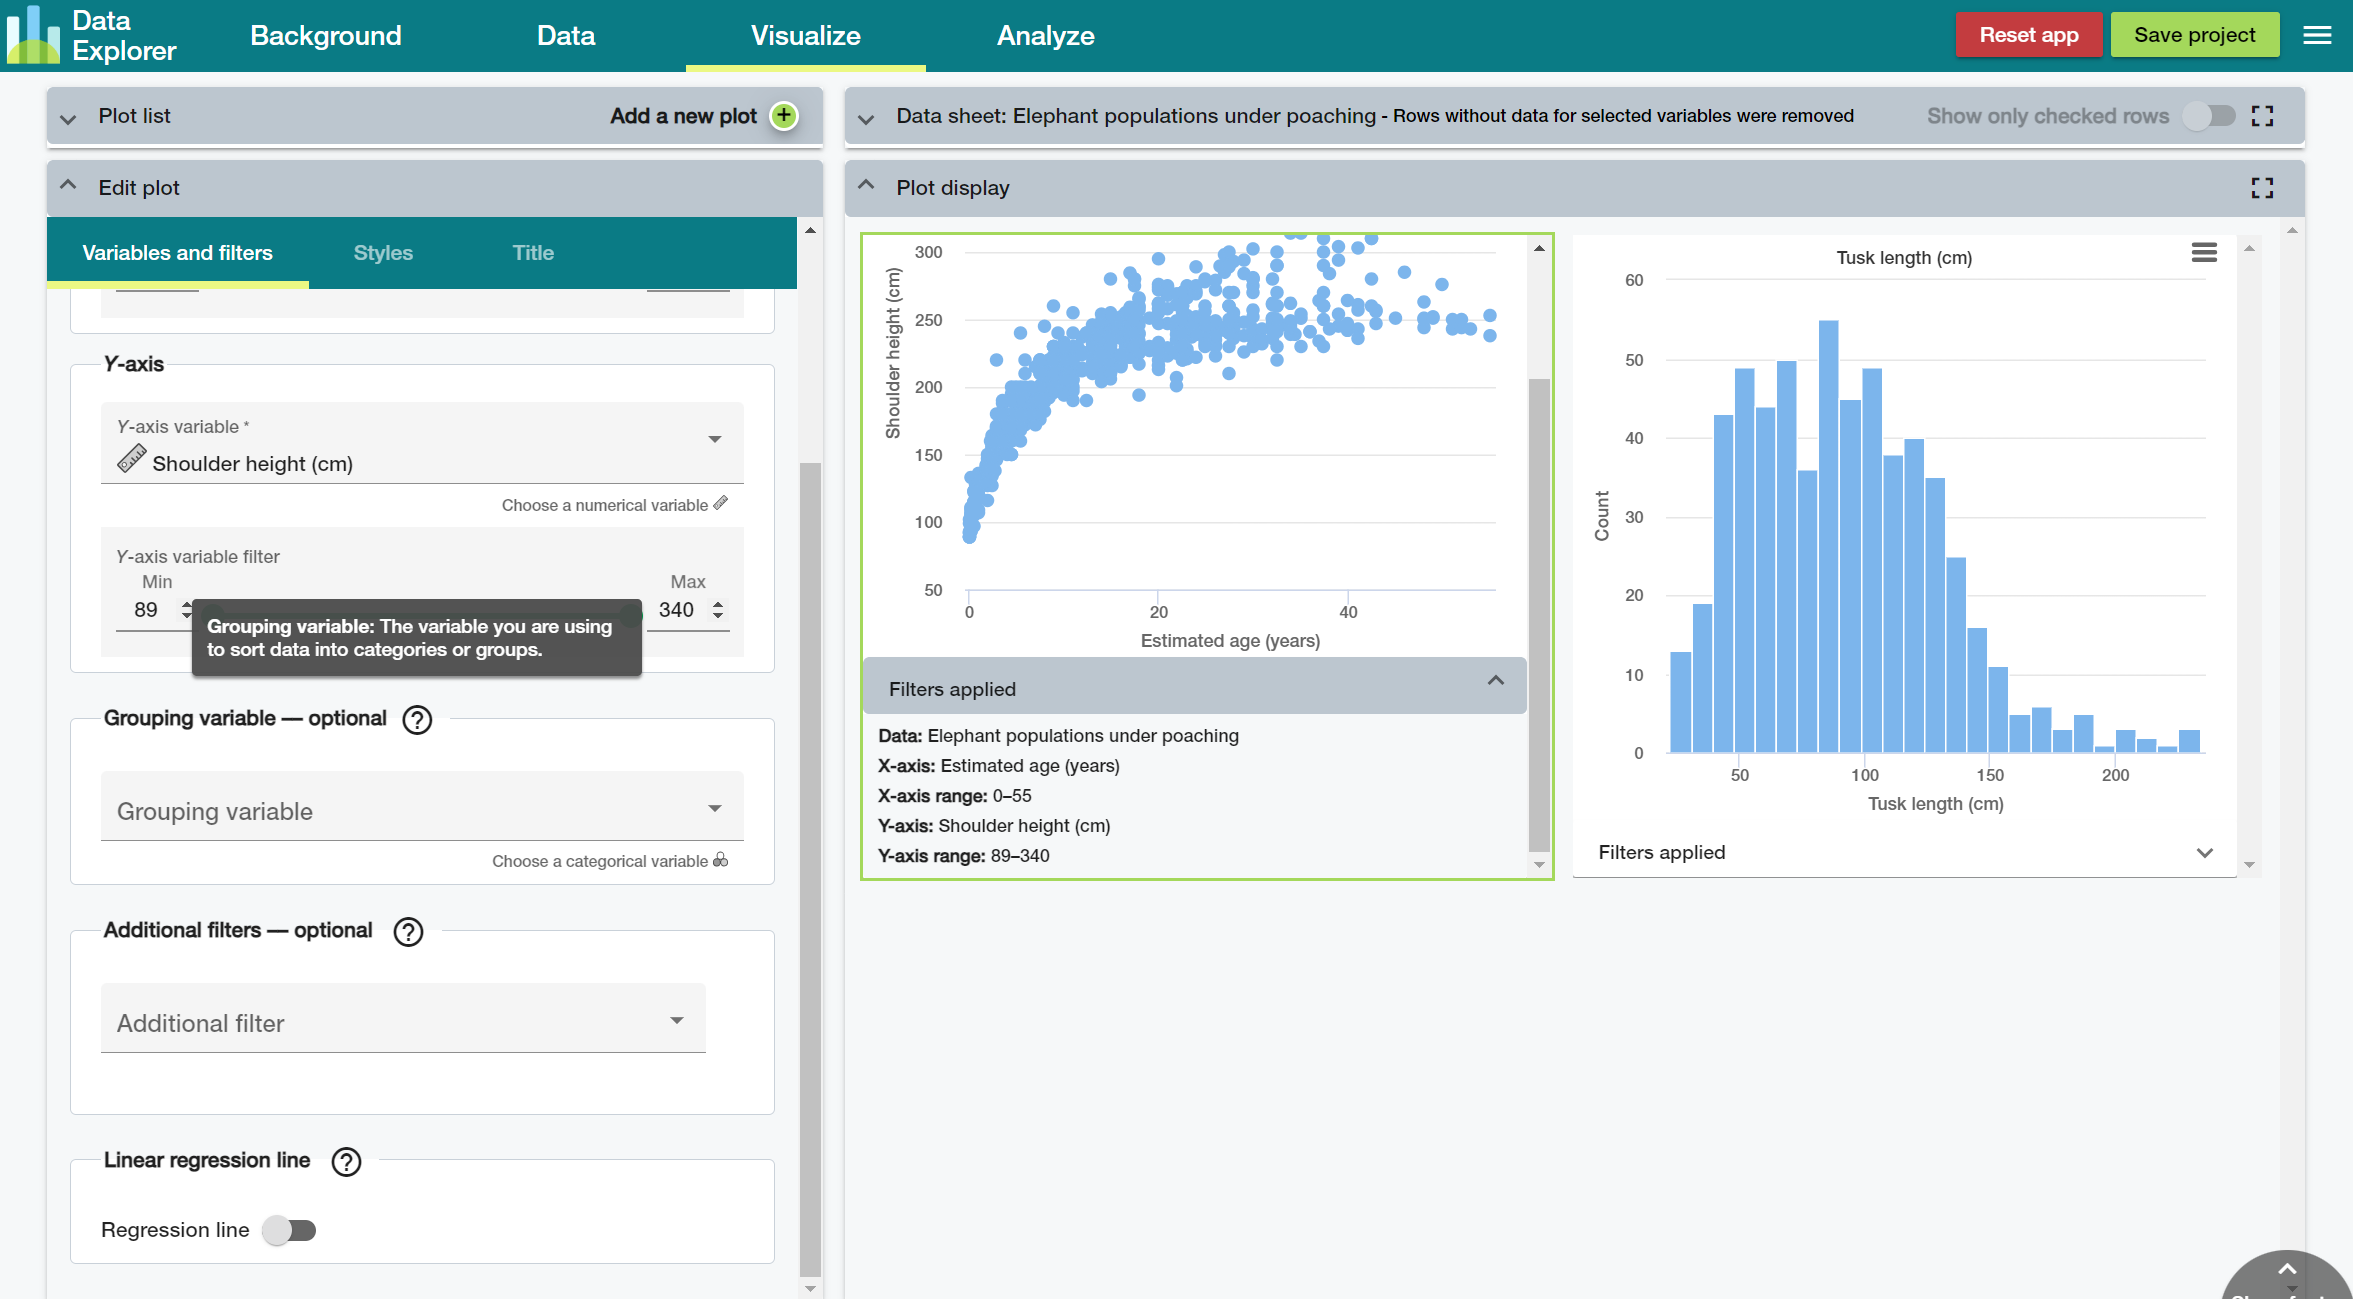
Added tooltips to minimize the text on screen but still make the additional information available.
Listed filters applied when students export the graphs, so that the teachers know what settings were used.
Allowed users to collapse some panels and mostly use the space for the panels of their interest.
Additional design assets
As a scientific illustrator and animator, I also created additional assets accompanying the web app.
Short promo video (sound on)
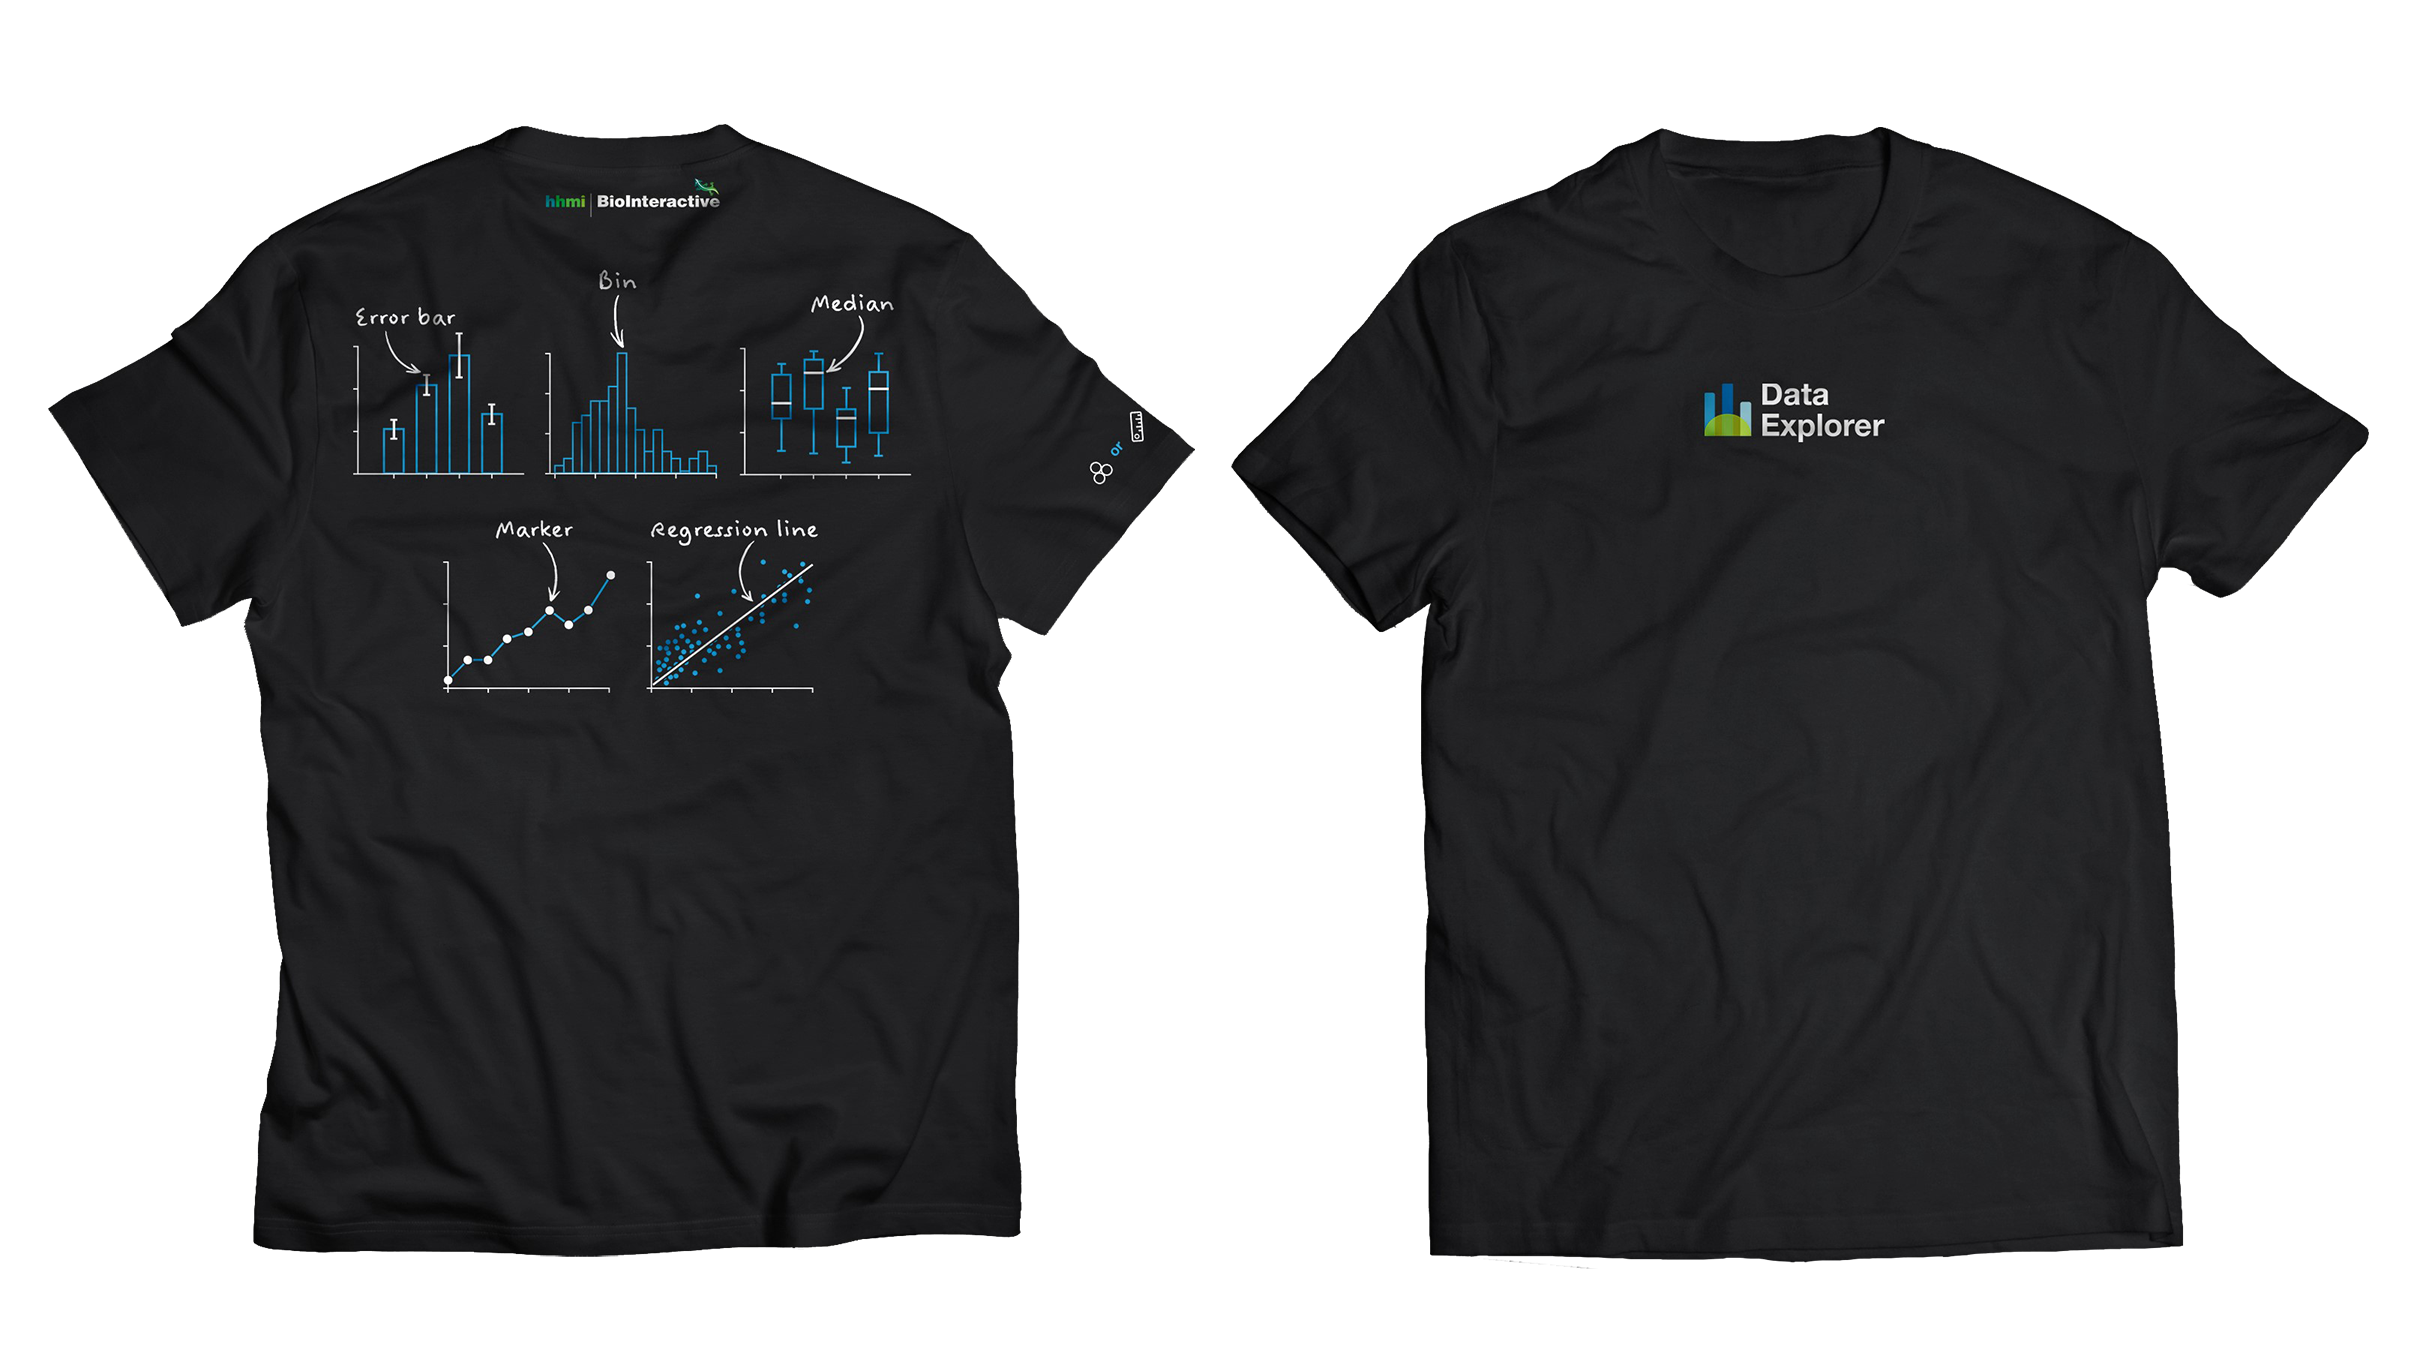
T-shirt
Retrospective
What went well…
- We performed a field test after the resource is published and received overwhelmingly positive feedback from the educators and students.
- This is the first complex statistical “tool” published by our group and has been used by many educators together with other resources.
- After the development phase started, we took some time to do more UX research to further understand the problem and the users’ needs, which helped us make some major decisions, and minimized the time spent discussing internally. There was doubt about the value of the focus group initially but it paid off in the end.
What could have gone better…
- Do the discovery as early as possible.
- Different stakeholders may have different interest on each aspect of the project. It would have been nice to have established a way to prioritize different requests/interests.